The latest price action on Bitcoin is sending a clear message:
volatility is back.
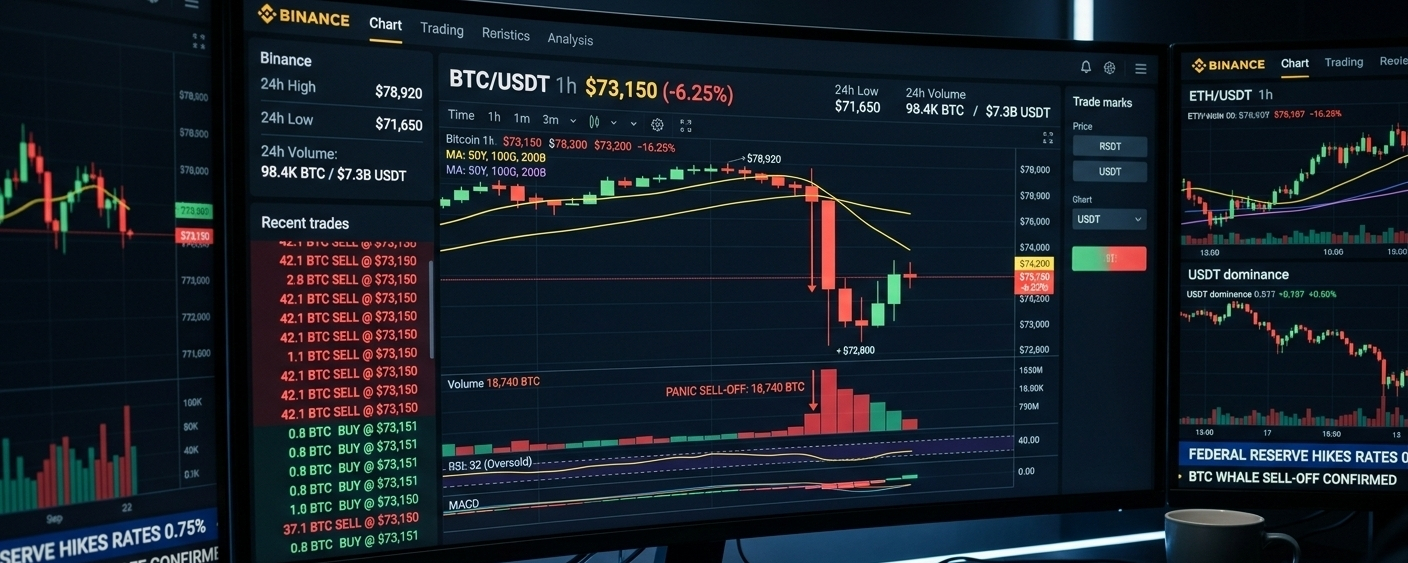
After pushing toward the $78.4K zone, BTC faced a sudden rejection — followed by a sharp drop and a quick attempt to stabilize.
So what’s really happening here?
📉 What the Chart Is Showing
Looking at the recent structure:
Price peaked near $78,450
Strong rejection followed
A rapid drop toward the $77,980 zone
Small bounce forming after the sell-off
👉 The key signal:
A large red volume spike during the drop — indicating aggressive selling.
This is not random movement.
This is liquidity being taken.
🔍 Key Levels to Watch
Right now, the market is sitting in a sensitive zone:
Resistance: $78,100 – $78,400
Support: $77,900 – $77,800
If BTC fails to reclaim resistance, we could see:
👉 Another leg down
👉 More stop-loss hunts
But if buyers step in strongly:
👉 Quick recovery toward highs is possible
⚡ What This Move Likely Means
This type of price action usually signals one of two things:
1. Liquidity Grab (Short-Term)
Big players push price up → trigger longs → dump → collect liquidity
2. Trend Weakness (If Continuation Happens)
Failure to hold levels → market structure shifts bearish
Right now, it leans toward a shakeout phase, not a full breakdown — but confirmation is needed.
📊 Volume Tells the Story
Volume doesn’t lie.
Sudden spike = strong participation
Red dominance = sellers in control (short term)
However…
After large sell-offs, markets often pause or reverse temporarily.
🧠 Trader Mindset
This is where most traders make mistakes:
Chasing after the drop ❌
Entering without confirmation ❌
Ignoring key levels ❌
Smart traders:
Wait for structure
Watch reactions at support/resistance
Trade probabilities, not emotions
🔥 Final Thought
This move isn’t random — it’s market mechanics in action.
Liquidity gets taken.
Positions get wiped.
Then the real move begins.
The question is:
👉 Was this the trap… or the start of something bigger?
⚡ Engagement Hook
Did you catch the move or get caught in it? 👀
Drop your bias below — bullish or bearish?
