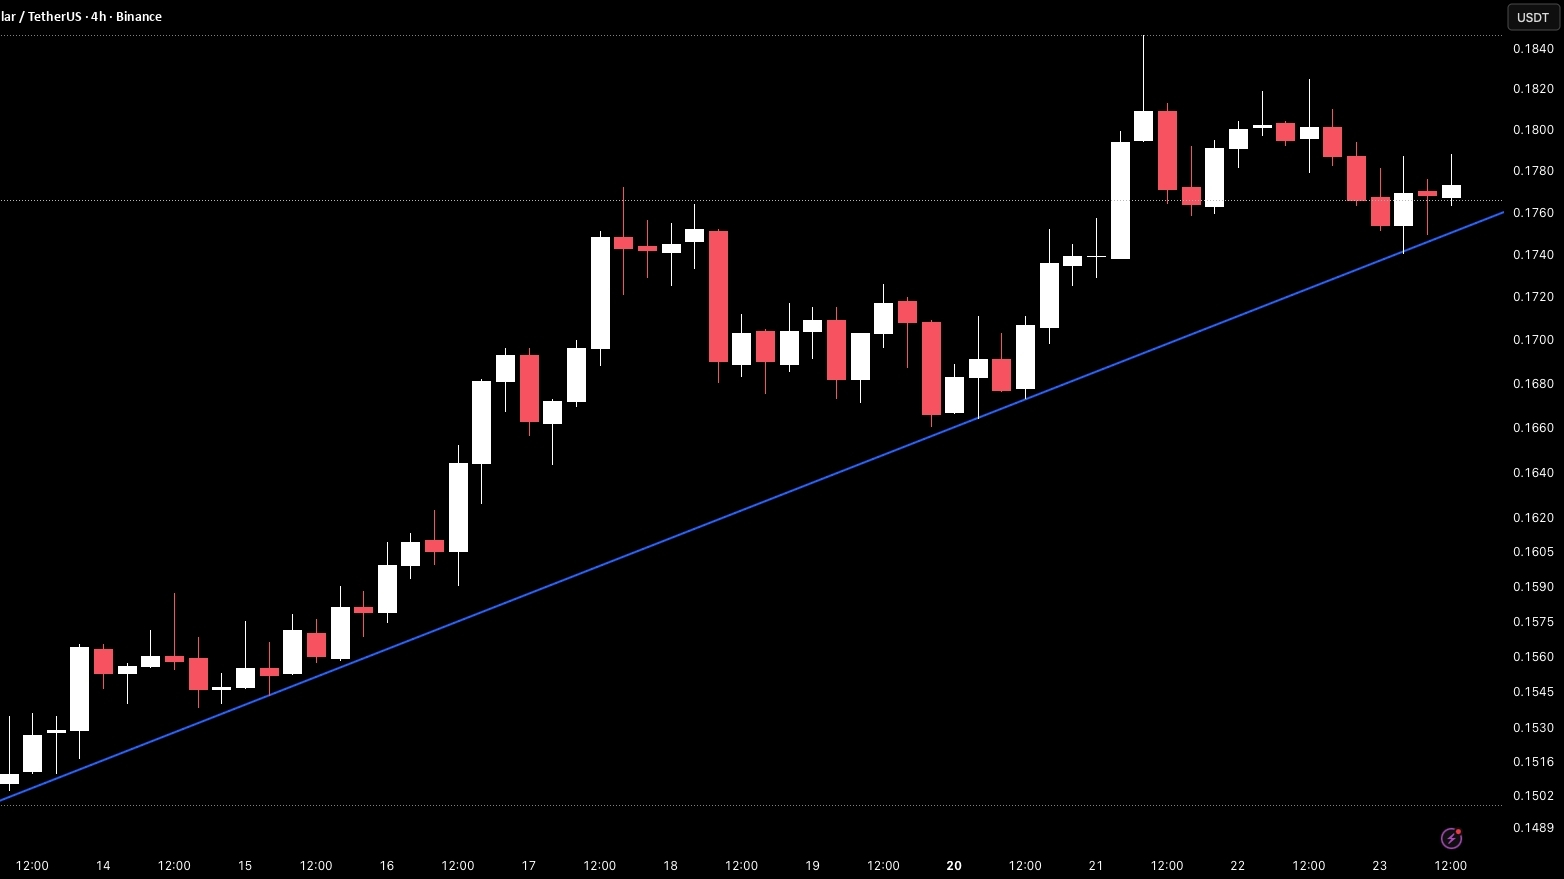

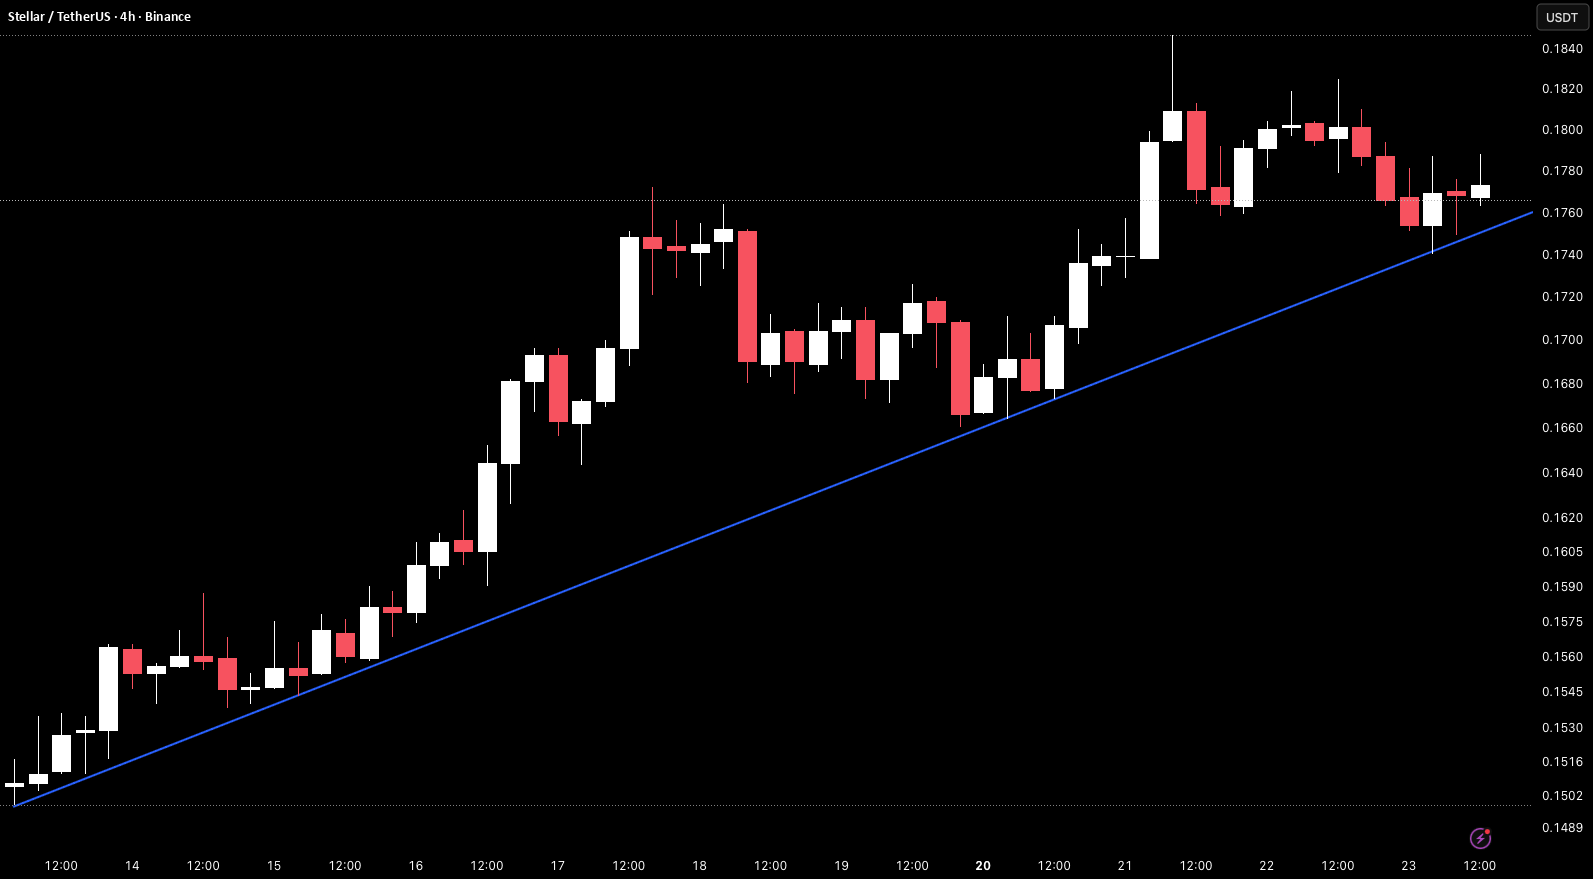
XLM on the 4H timeframe is currently trading around 0.1776 after a strong rally from the rising trendline that pushed price all the way to 0.1840 before pulling back.
Price has now retraced back toward the rising trendline from the April 13 lows, which is currently converging with a horizontal support zone near 0.1760–0.1776, making this a key confluence area.
The trendline has been respected consistently throughout the move, producing higher lows at every touch.
Key Levels To Watch
0.1840 → Recent high, key resistance above
0.1800 → Minor resistance, prior reaction zone
0.1776–0.1780 → Current price, horizontal support zone
0.1760 → Rising trendline support, current confluence test
0.1680–0.1690 → Prior consolidation support below
Below 0.1510 → Full structure breakdown
The rising trendline has guided every higher low since April 13 and is now being tested directly at current levels.
A hold here would keep the bullish structure intact and set up a potential continuation toward 0.1840 and beyond.
Failure to hold the trendline near 0.1760 would break the higher-low sequence and shift focus toward 0.1680–0.1690 as the next support zone.
This is a trendline retest setup.
Hold 0.1760 trendline → structure intact, eyes on 0.1840+.
Lose 0.1760 → higher-low sequence breaks, pullback toward 0.1680.
Structure bullish above rising trendline.
Bias shifts only on confirmed trendline breakdown.
