📊 What the chart is showing
1. Trend
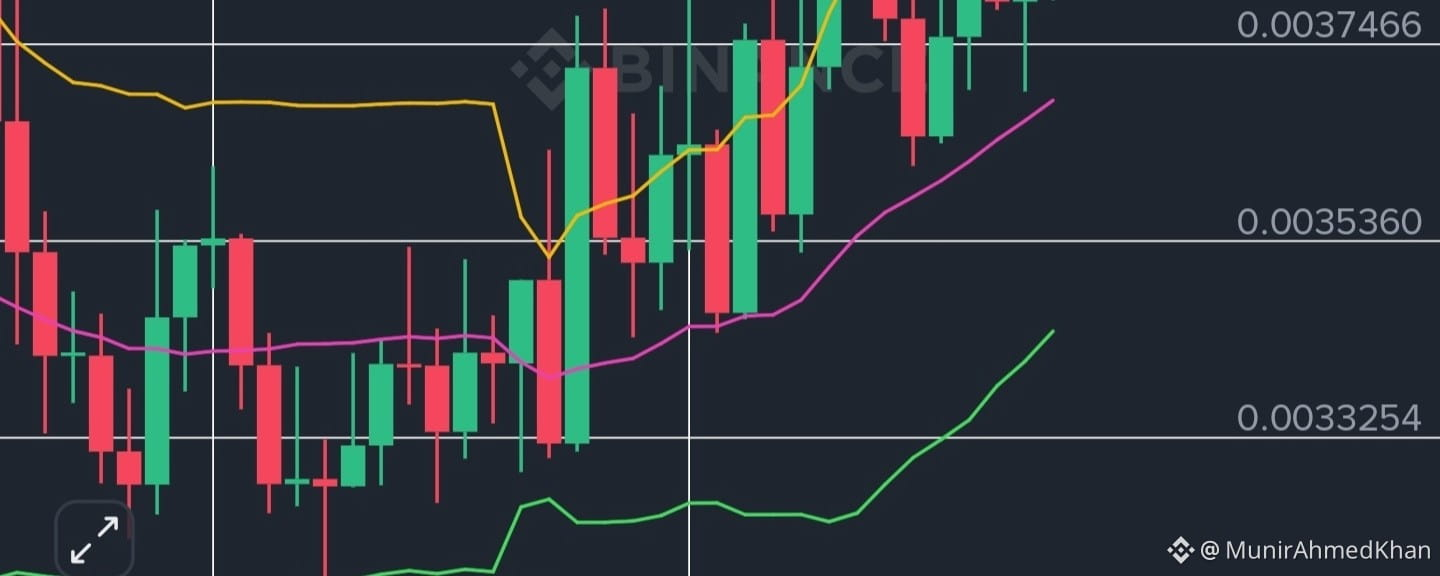
Price is in a short-term uptrend (higher lows forming).
Recently pushed up to ~0.0041, then pulled back.
Now consolidating around 0.00384.
👉 This looks like a pullback after a bullish move, not a full reversal (yet).
2. Bollinger Bands (BOLL)
Price is sitting near the middle band (MB ~0.003686).
Upper band ~0.00393 is acting as resistance.
Lower band ~0.00344 is support.
👉 Interpretation:
You’re in a neutral zone right now.
Break above upper band = bullish continuation
Drop below mid-band = potential weakness
3. MACD
MACD is barely positive (weak momentum).
Lines are close together → indecision / consolidation.
👉 Translation: momentum is not strong, market is waiting.
4. Structure
Key support: 0.00370 – 0.00375
Stronger support: 0.00343
Resistance: 0.00395 – 0.00410
🧠 What this usually means
Right now this is a range / consolidation phase after a pump.
Two likely scenarios:
🟢 Bullish case
Holds above 0.0037
Breaks 0.00395–0.0041
Then continuation upward
🔴 Bearish case
Loses 0.0037
Drops toward 0.0034
That would invalidate the current uptrend
⚠️ Important reality check
This is not a clean breakout setup yet.
It’s a decision zone — entering here is basically betting.
💡 If you were trading this (general logic)
Safer long: after breakout above 0.0041
Safer short: if it loses 0.0037
Current zone: chop / fakeouts likely
If you want, tell me:
your entry
long or short idea
…and I’ll give you a much more precise setup (including risk levels).