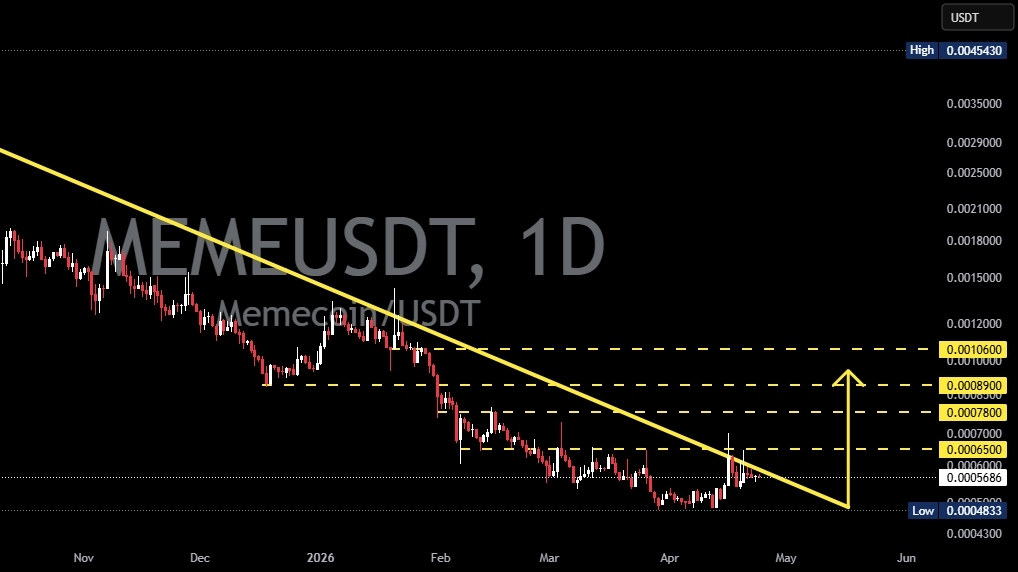

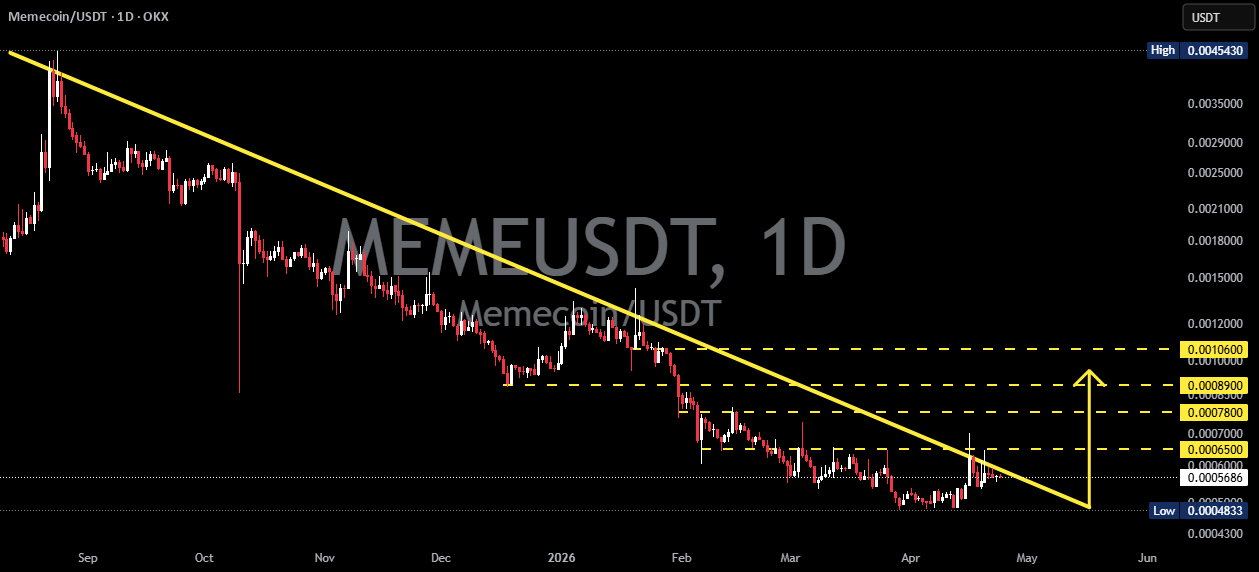
The MEME/USDT (1D) chart shows a strong downtrend from previous highs, marked by consistent lower highs and lower lows. The descending trendline continues to act as a major resistance.
Currently, price is testing the trendline breakout area after a long consolidation phase at the bottom, indicating a potential shift in momentum.
---
📐 Structure & Pattern
Main observed pattern:
➡️ Descending Triangle / Falling Structure (Bearish Bias)
Diagonal resistance continues to suppress price
Horizontal support remains relatively stable
Volume is decreasing → sign of accumulation or seller exhaustion
➡️ However, toward the end:
A base / accumulation zone is forming
Multiple lower rejections → indication of growing buying interest
💡 This opens the possibility of an early reversal structure if a valid breakout occurs.
---
📊 Key Levels
Key Support: 0.00048 – 0.00056
Resistance Levels:
0.00065
0.00078
0.00089
0.00106 (major resistance)
---
🚀 Bullish Scenario
If price manages to:
✅ Break and close above the trendline resistance
✅ Hold above 0.00065
Then potential movement:
📈 Upside targets:
0.00078
0.00089
0.00106
🔥 Strong confirmation if:
Successful retest of the trendline as new support
Increasing volume during breakout
➡️ This could signal an early trend reversal after a prolonged downtrend.
---
⚠️ Bearish Scenario
If price fails to break out and:
❌ Gets rejected at the trendline
❌ Loses support at 0.00056
Then potential downside:
📉 Move toward:
0.00050
0.00048 (last support)
💀 A breakdown below this zone could lead to a new lower low and continuation of the long-term bearish trend.
---
📌 Conclusion
Structure remains bearish, but momentum is weakening
Price is at a critical decision zone
Breakout or rejection from the trendline will determine the next move
👉 This is a high risk – high opportunity phase
