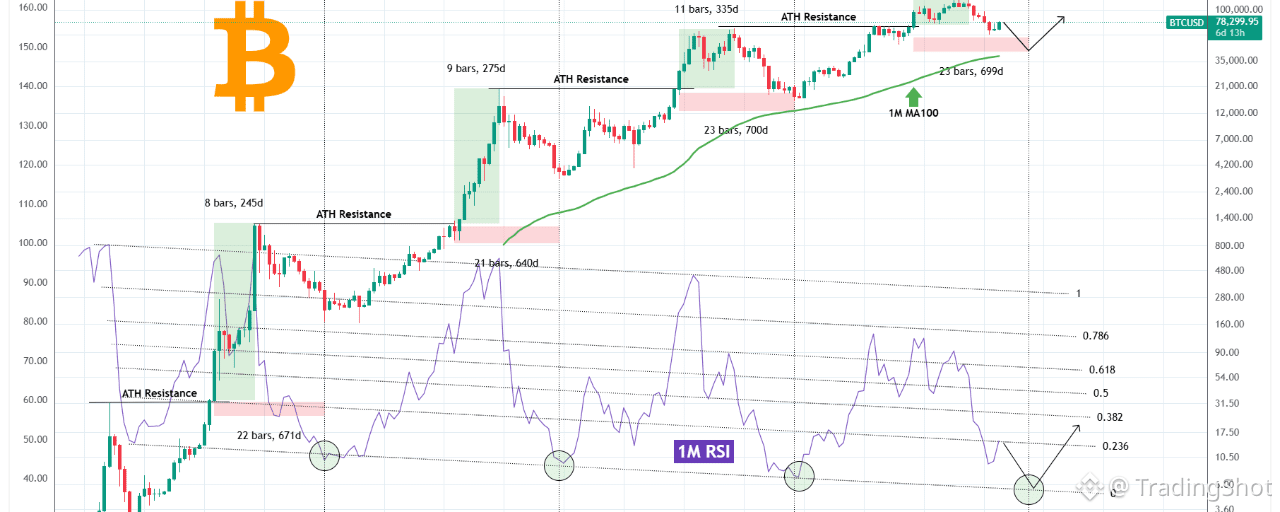
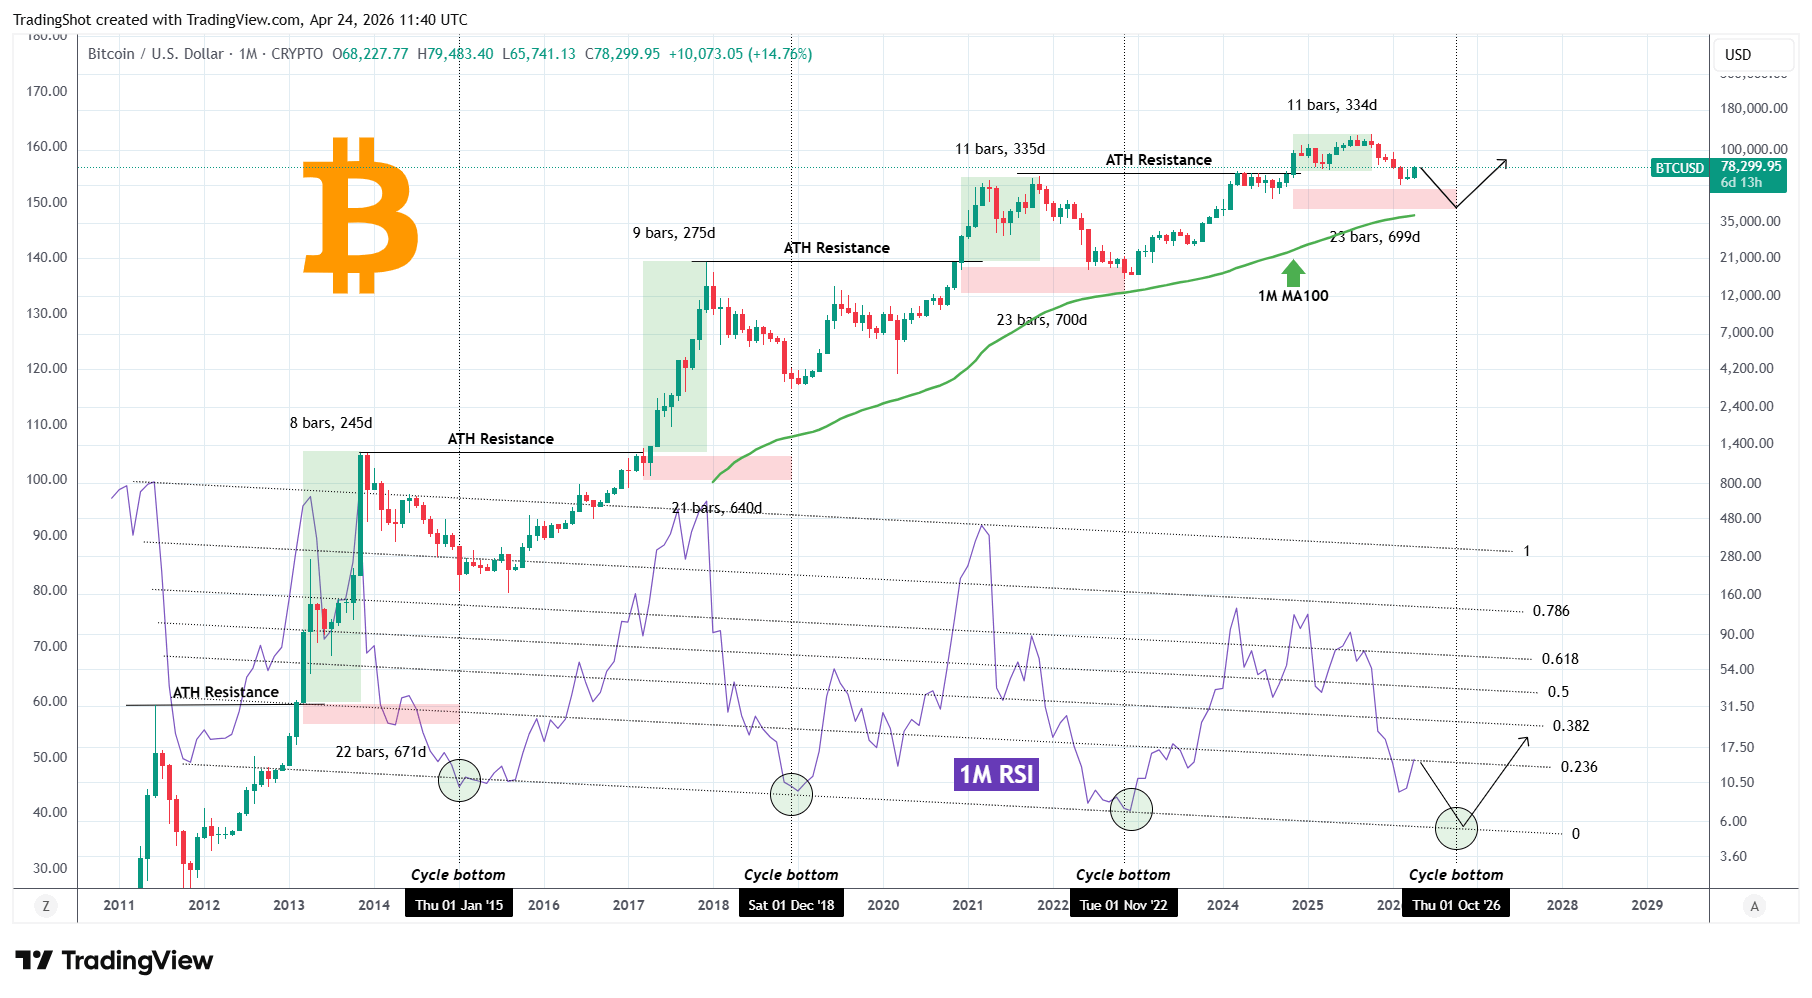
Bitcoin (BTCUSD) has historically made a Cycle Top within 8 - 11 months after the price made a convincing 1M candle closing above the previous All Time High (ATH) Resistance. At the same time, it has made a Cycle Bottom within 21 - 23 months after that same break-out occurred.
While that technical evidence is enough alone, here comes the 1M RSI to further confirm that model. Those same Cycle bottoms have occurred at or 1 month before the 1M RSI hit its Lower Lows trend-line (Fibonacci Channel bottom) as shown by the green circles.
Based on the above, an October 2026 Cycle bottom is very likely to occur and with the 1M MA100 (green trend-line) posing as the next Cycle Support, this can take place within a $45000 - 40000 Zone.
Please LIKE 👍, FOLLOW ✅, SHARE 🙌 and COMMENT ✍ if you enjoy this idea!