Based on the chart of OpenGradient ($OPG /USDT) you've shared, it looks like you're caught in a classic technical showdown between a long-term support zone and a descending trendline.
Here is a breakdown of what the chart is telling us and the potential "next moves" to consider.
🔍 Technical Analysis
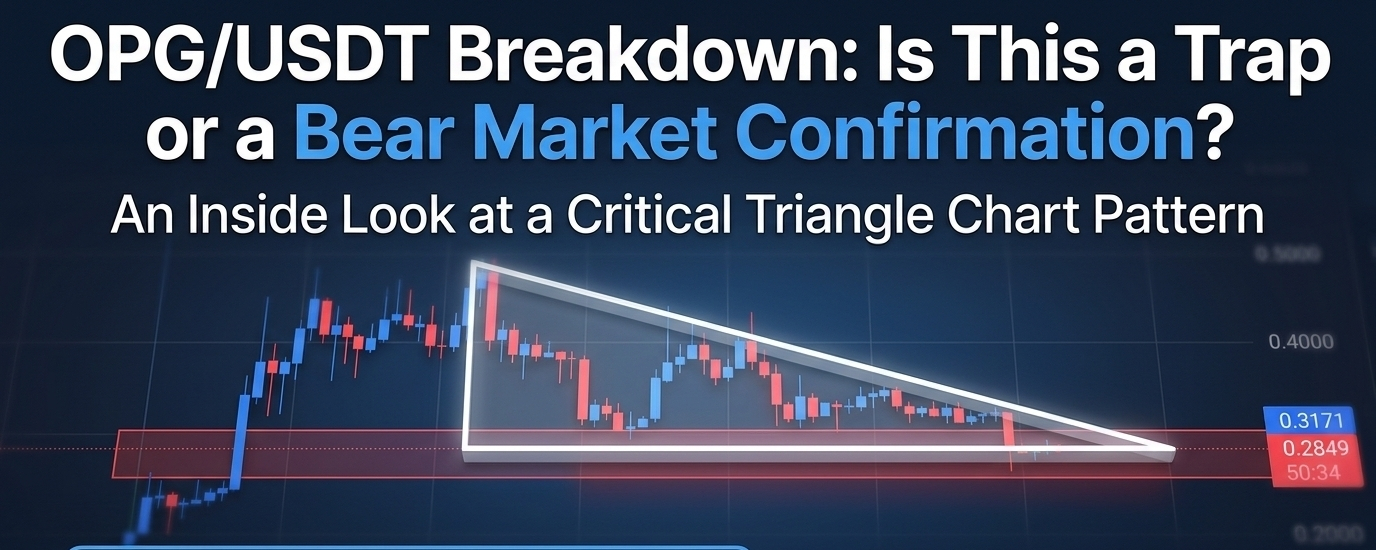
1. The Descending Triangle
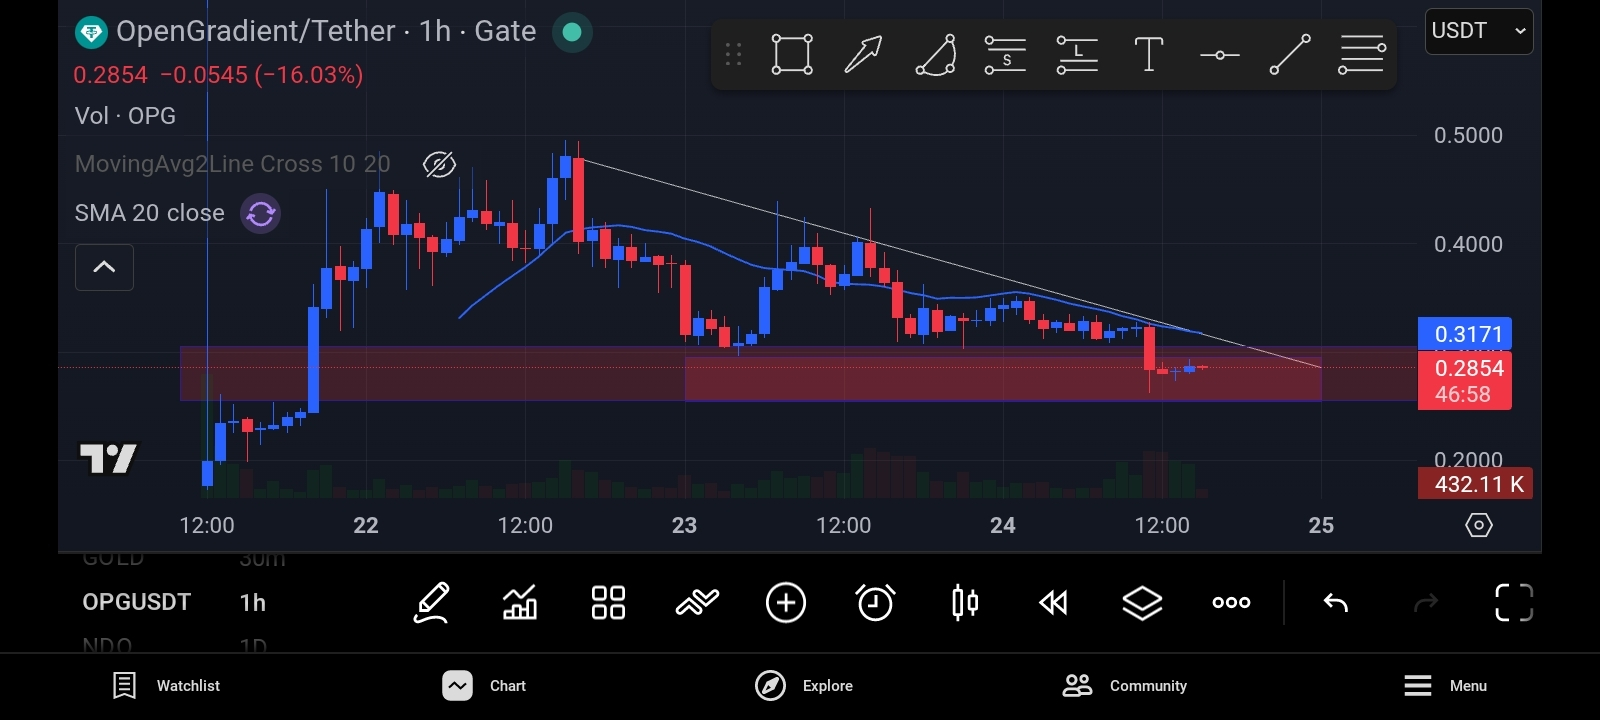
You have a clear descending trendline (the white diagonal line) connecting lower highs. This indicates that sellers are becoming more aggressive, pushing the price down faster than buyers can push it up.
2. Support Zone Breach
The red horizontal box represents a major support zone (roughly around the $0.29 - $0.31 range).
The Bad News: The current price ($0.2849) has actually dipped below that red box.
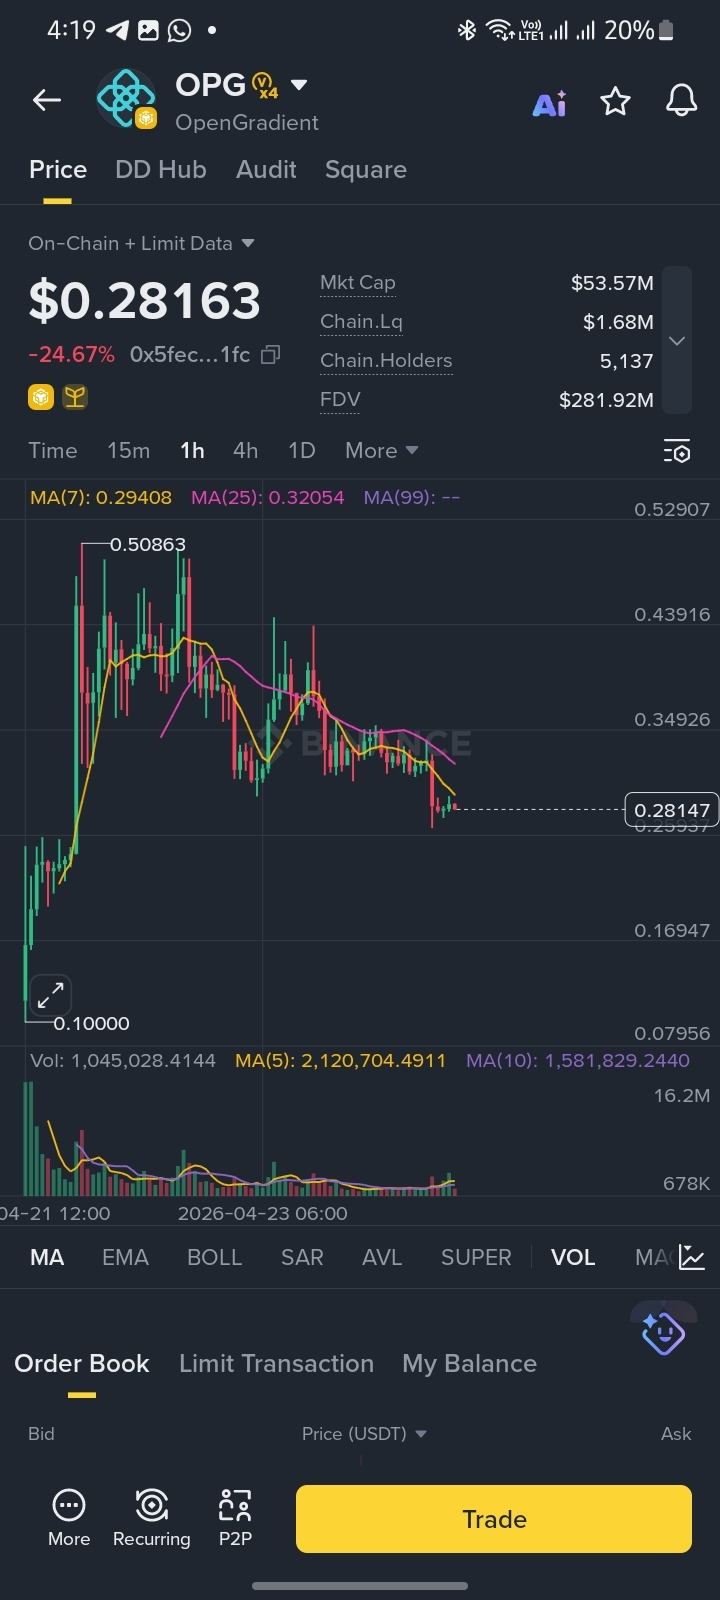
The Sentiment: A 16% drop today suggests strong bearish momentum. When a price breaks below a long-held support zone, that zone often flips and becomes "resistance" (a ceiling the price struggles to break back above).
3. Moving Average (SMA 20)
The price is currently trading below the SMA 20 (the blue wavy line). In technical analysis, being below the SMA 20 generally confirms a short-term downtrend.
🛠️ What to do next?
Trading is about probabilities, not certainties. Here are three common scenarios based on this specific setup:
Scenario A: The Conservative Play (Wait for Confirmation)
Since the price just broke support, it is "no man's land."
The Move: Do nothing yet. Wait to see if the hourly candle closes back inside the red box or stays below it.
Reason: If it stays below, the next stop could be the previous swing low near $0.20.
Scenario B: The "Short" or "Exit" Play
If you are currently holding OPG and it fails to reclaim the $0.30 level quickly:
The Move: Consider tightening your stop-loss or exiting a portion of the position.
Reason: A "break and retest" of the support-turned-resistance is a classic signal that more downside is coming.
Scenario C: The Reversal Play (Bullish)
The Move: Wait for the price to break above the white diagonal trendline with high volume.
Reason: Until that diagonal line is broken, any upward movement is just a "relief rally" within a larger downtrend. A break above the trendline would signal a change in market structure.
💡 Pro-Tip: Watch the Volume
Look at the bars at the bottom. If the price continues to drop on rising volume, it means the "big money" is selling. If the volume is low during this dip, it might just be a "fakeout" or a hunt for liquidity before a bounce.
⚠️ Disclaimer: I'm Just a trader not a God, not a financial advisor. Crypto is highly volatile (especially coins with 16% daily swings). Never trade more than you can afford to lose!