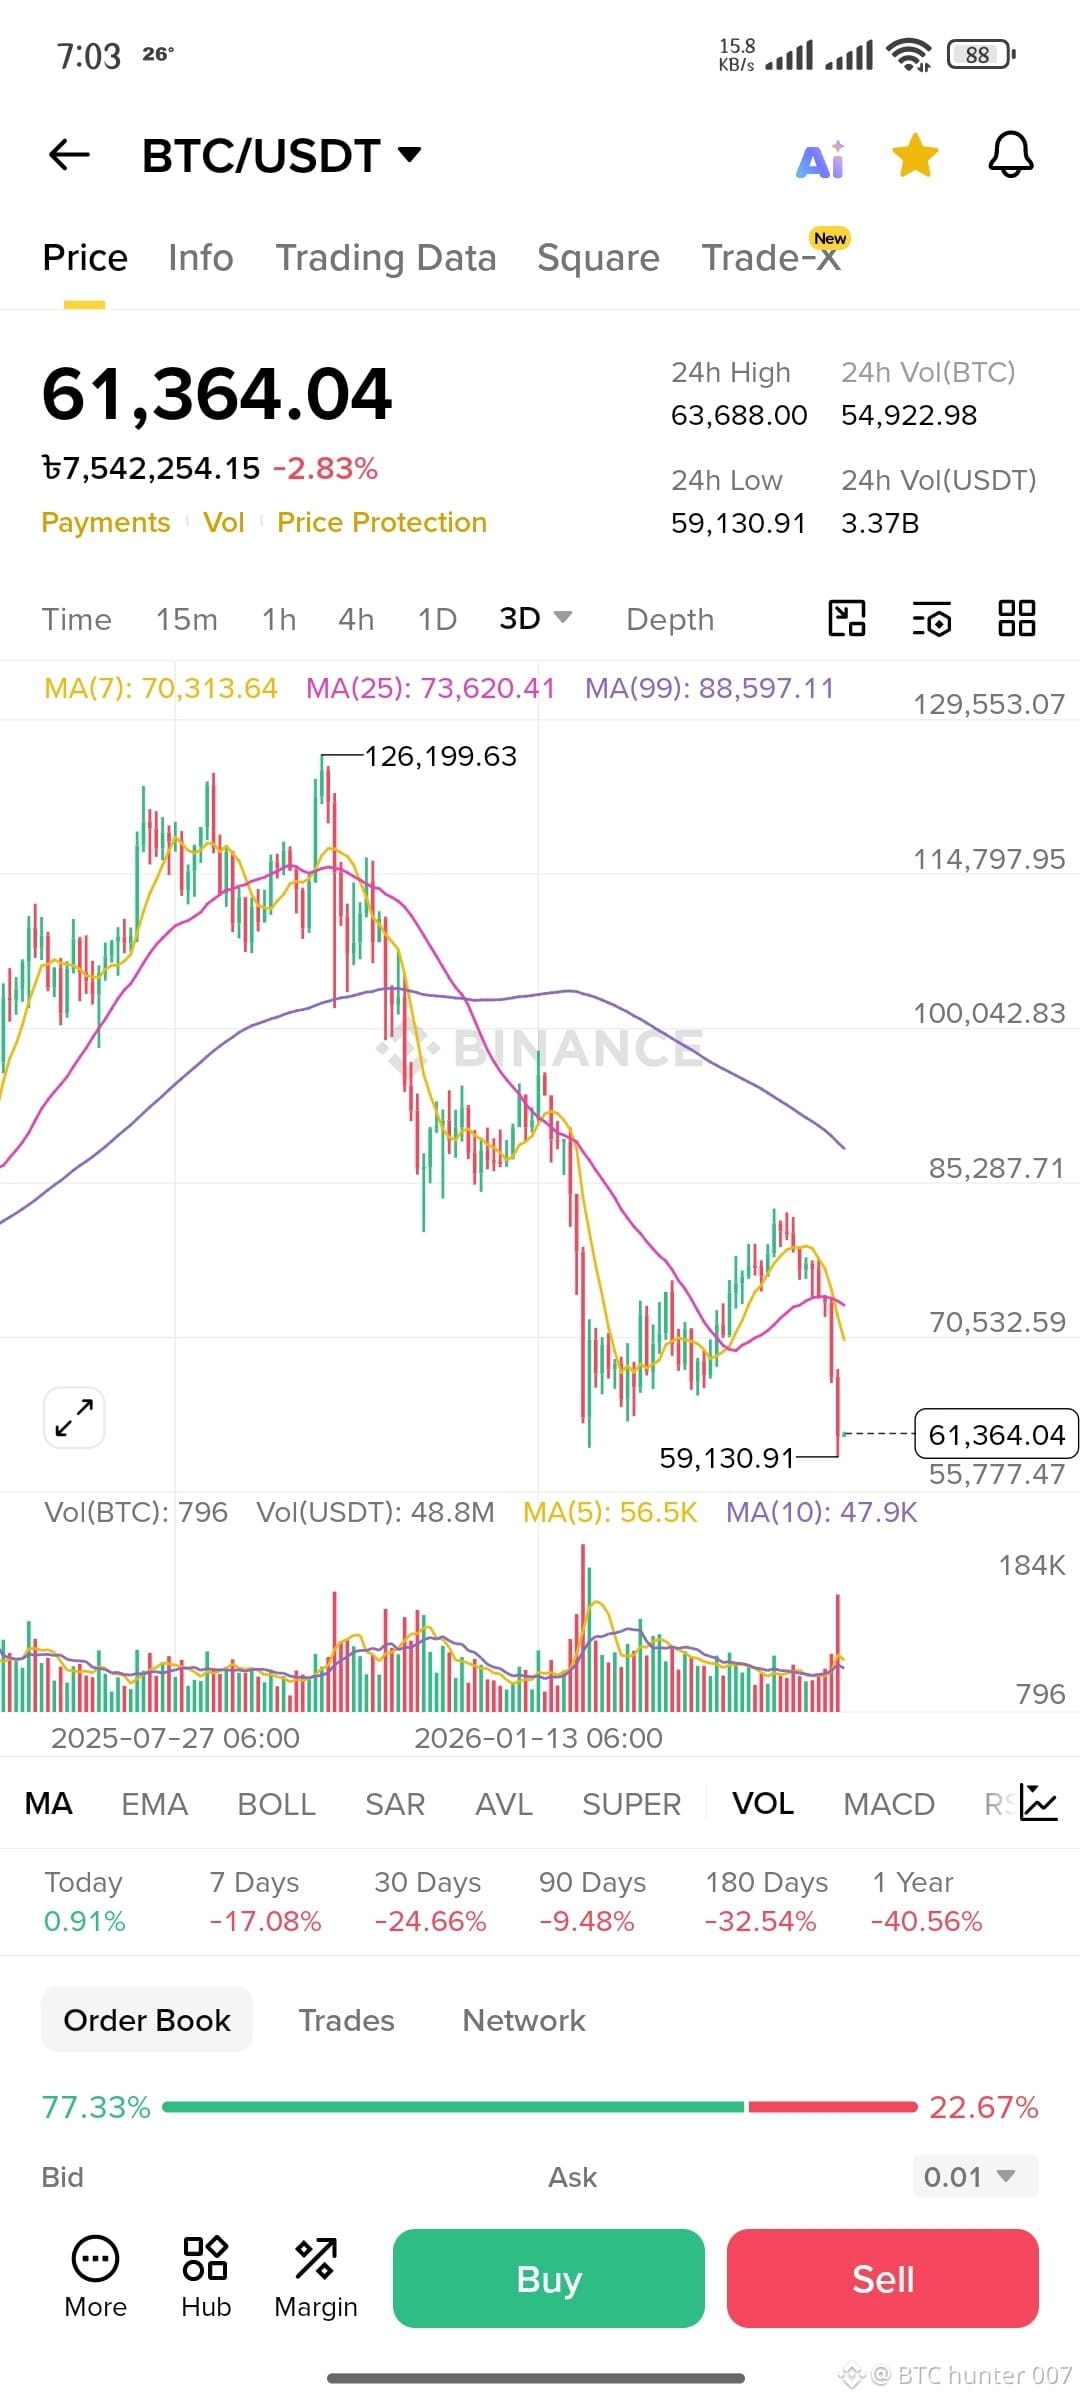
BTC/USDT Technical Analysis: Critical Levels to Watch! 🚨
The Bitcoin 3D chart is currently showing a strong bearish structure after a sharp rejection from its higher levels. Here is a breakdown of the key support and resistance zones based on the current price action around $61,364:
🛑 Resistance Zones (Rejection Levels)
Major Resistance (Psychological Rejection): $100,000
This remains a massive psychological and technical barrier. The chart shows a heavy rejection structural alignment around this zone, making it the primary target for long-term bulls to reclaim.
Intermediate Resistance: $90,000
On the mid-term timeframe, the $90,000 area acts as a strong supply zone. Any relief rallies will likely face heavy selling pressure here.
🟢 Support Zones (Demand Levels)
Immediate Support: $59,130
Bitcoin is currently hovering just above its immediate local bottom at $59,130.01. Holding this level is crucial for short-term price stabilization.
Major Macro Support: $49,000 (Strong Demand) ⚠️
If the immediate support at $59,130 breaks and the price sustains below the $60,000 psychological mark, a further downside extension is highly likely.
A major, high-liquidity macro support sits firmly at the $49,000 level. This is the ultimate defensive line for bulls where massive buying interest is expected.
📉 Market Sentiment & Strategy
Trend: The overall higher-timeframe (3D) trend is currently leaning bearish, as indicated by the descending candlestick patterns and moving average alignments.
Trading Caution: Taking new long entries right here is highly risky without a clear reversal pattern or strong bullish confirmation from the $59k–$60k zone. Watch the volume and daily closes closely before making your next move.
Disclaimer: This analysis is for educational purposes only and does not constitute financial advice. Always manage your risk properly.
#BTC #technicalanalyst #CryptoPatience #BinanceSquareTalks