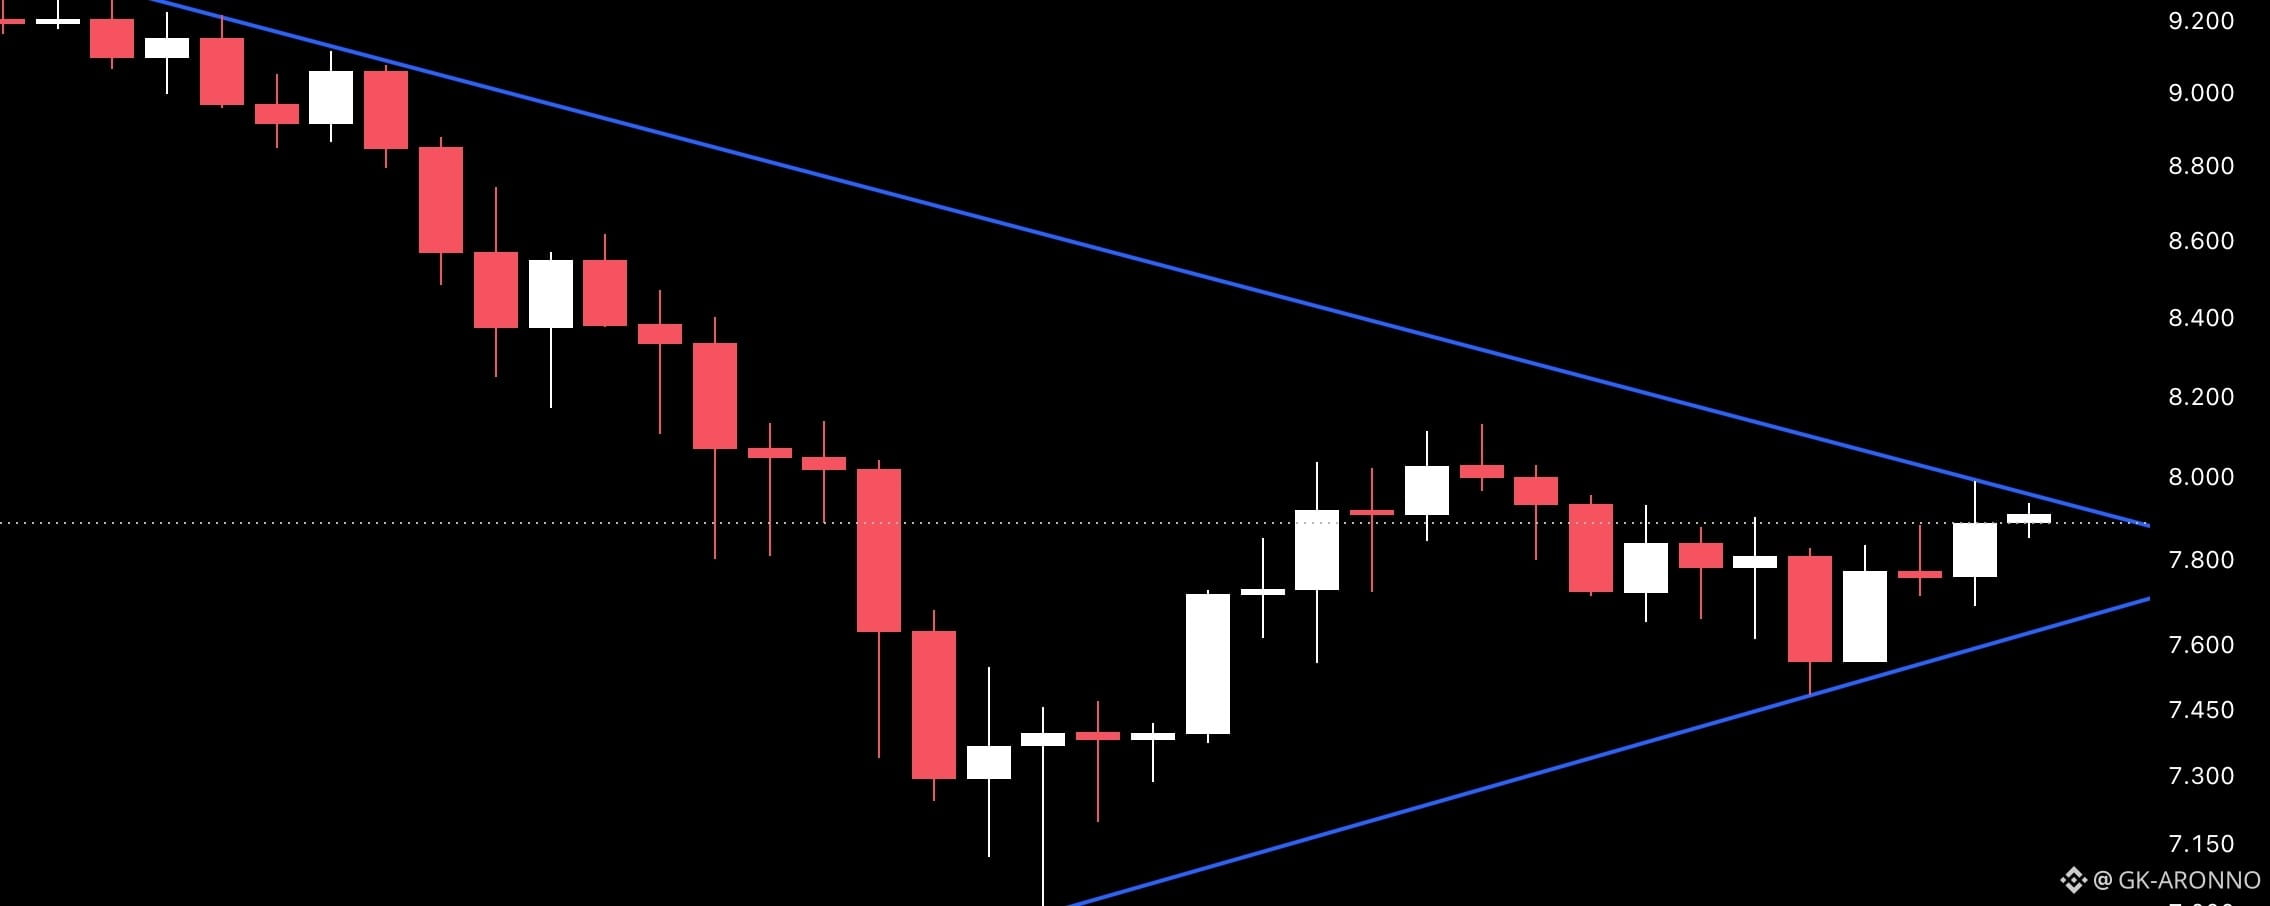

LINK on the 8H timeframe is currently trading around 7.908 inside a descending wedge structure formed by a descending resistance trendline from the June 1 highs near 9.400 and a rising support trendline from the June 5 lows near 7.000.
Price dropped sharply from 9.400 to a low near 7.000 before the rising trendline provided support and produced a recovery back toward the descending resistance. Price is now pressing directly into the descending resistance near 7.900–8.000 and the horizontal resistance zone at 7.900–8.000 that has capped multiple recovery attempts since June 7.
Both trendlines are now converging and a directional move is approaching.
Key Levels To Watch
9.400 → Prior high, descending resistance origin
8.800–9.000 → Prior support zone, now resistance above
8.200–8.400 → Prior breakdown zone, now resistance
7.900–8.000 → Descending resistance trendline and horizontal resistance, current test
7.600–7.650 → Rising trendline support (dynamic, climbing)
7.000 → Wedge low, major support floor
Below 6.860 → Full structure breakdown
The descending wedge has been compressing since the early June sell-off and price is now at the critical resistance zone where the descending trendline meets the horizontal level at 7.900–8.000.
A clean break and close above 8.000 would clear both the descending resistance and horizontal zone, resolving the wedge bullishly and opening room toward 8.200–8.400 and beyond.
Failure to break above 8.000 and a pullback below 7.650 shifts focus back to the rising trendline as the next key support, with the 7.000 wedge low as the ultimate floor.
This is a wedge decision point at resistance.
Break above 8.000 → wedge resolves bullish, eyes on 8.400–8.800.
Reject at 8.000 → back toward trendline at 7.600–7.650.
Neutral inside wedge.
Bias only on confirmed breakout or breakdown.
