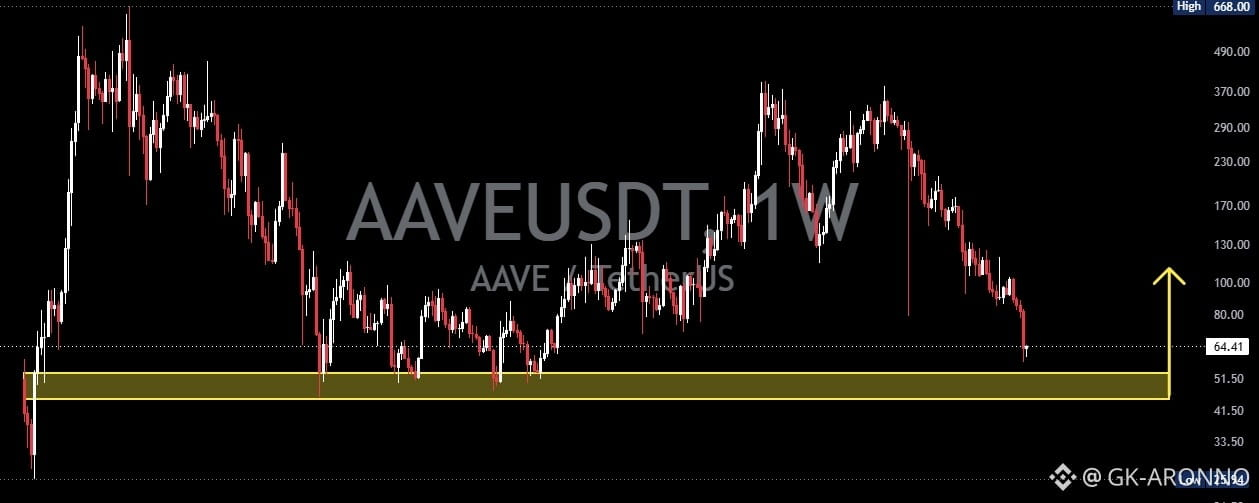

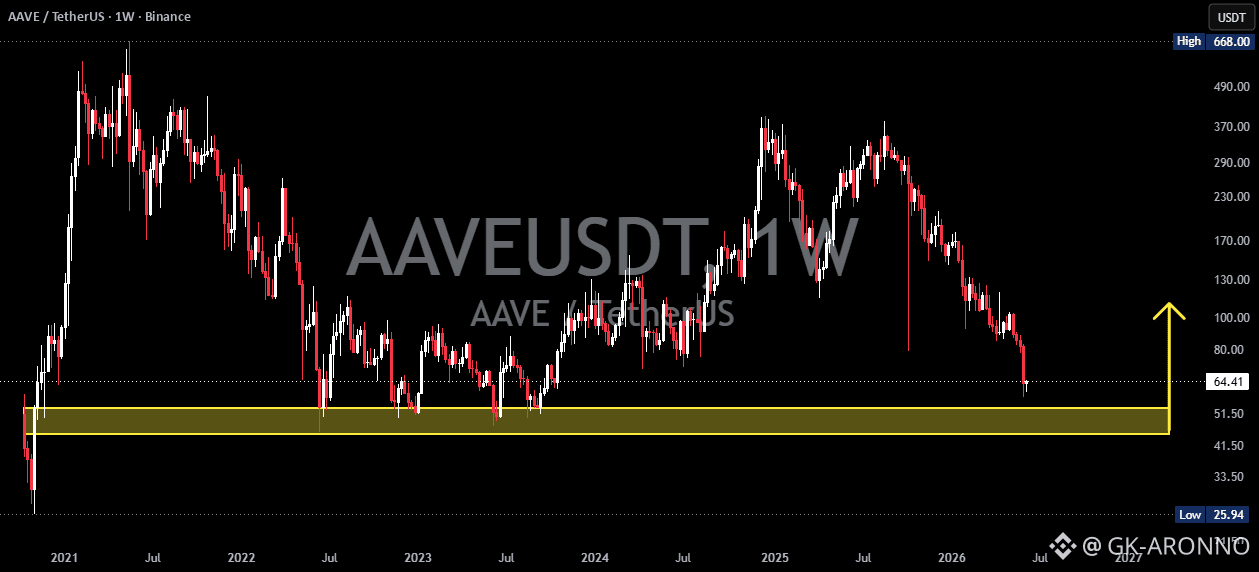
📊 AAVE is currently trading on the Weekly (1W) timeframe and has once again reached a strong historical demand zone between $53.5 and $45, an area that has acted as a major reversal point multiple times since 2022.
After a prolonged decline from its previous cycle highs, price is now approaching a critical support level that has successfully absorbed selling pressure for several years. The market's reaction within this zone could determine the direction of the next major trend.
---
📈 Current Market Structure
✅ Price has been forming a Lower High (LH) and Lower Low (LL) structure since the 2025 peak.
✅ Bearish momentum still dominates the medium-term trend.
✅ However, price has now reached a weekly support area with a strong history of accumulation.
✅ The yellow zone ($53.5 – $45) represents a key demand area that has previously triggered significant rebounds.
---
🔍 Pattern Formation
🟡 Major Demand Zone Retest
AAVE is currently retesting a major demand zone that has remained relevant for more than three years.
📌 Key Characteristics of This Zone:
🔸 Served as the foundation of previous bullish trends.
🔸 Repeatedly rejected strong selling pressure.
🔸 Has the potential to act as an institutional accumulation area.
🔸 Represents an important psychological level for market participants.
As long as this area holds, the possibility of forming a long-term bottom remains intact.
---
🟡 Potential Long-Term Double Bottom
If price successfully holds the $53.5 – $45 area and produces a strong reversal, the structure could evolve into:
🔹 Double Bottom
🔹 Accumulation Base
🔹 Macro Reversal Structure
📈 Patterns like these often mark the beginning of a new bullish cycle after an extended correction.
---
🟢 Bullish Scenario
The bullish outlook becomes increasingly valid if:
✅ The $53.5 – $45 demand zone holds.
✅ Strong weekly rejection candles appear.
✅ Buying volume starts to increase.
✅ Price reclaims the key resistance level above $80.
🎯 Bullish Targets:
🎯 $80
🎯 $100
🎯 $130
🎯 $170
🎯 $230
🎯 $300+
🚀 If the broader crypto market regains strength, AAVE could establish a new uptrend from this demand zone.
---
🔴 Bearish Scenario
The bearish scenario would be confirmed if:
❌ A weekly candle closes below $45.
❌ The historical demand zone fails to hold.
❌ Selling pressure continues to increase without meaningful buyer response.
⚠️ A confirmed breakdown could send price toward lower support levels that have not been significantly tested since the early stages of the previous cycle.
📉 This would increase the probability of further downside before a new market bottom is established.
---
⚡ Conclusion
AAVE is currently trading within one of the most important technical zones in its price history.
🟨 The $53.5 – $45 area represents a major demand zone that has repeatedly acted as a market turning point.
🟢 As long as this zone remains intact, the possibility of accumulation and a long-term bottom formation remains on the table.
🔴 However, if support fails, the risk of a deeper correction will increase significantly.
⏳ The coming weeks will be crucial in determining whether AAVE is building the foundation for a new bullish cycle or preparing for a continuation of its longer-term bearish trend.
💬 What do you think? Will this demand zone become AAVE’s next launching pad?
👇 Share your thoughts in the comments!
