Technical Analysis of the Provided ETH/USDT Chart
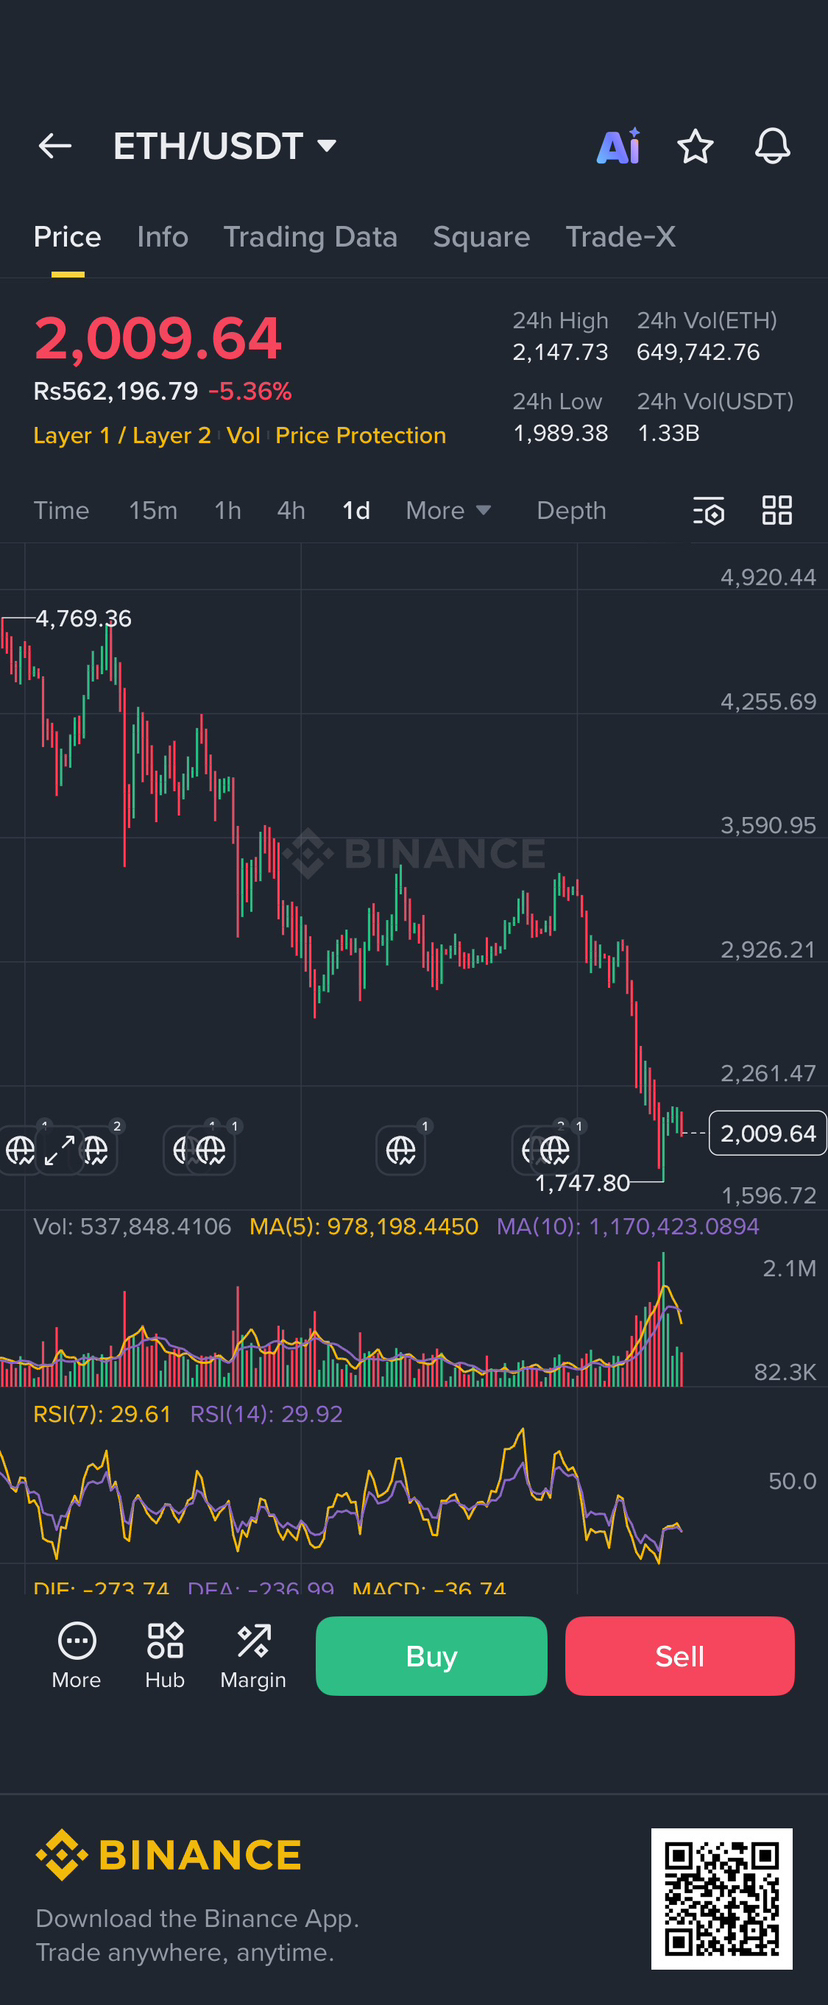
The screenshot shows ETH/USDT trading at approximately $2,009.64 on Binance, with a 24-hour change of -5.36%. The candlestick chart depicts a sharp downtrend, starting from a high around $4,769.36 and declining steeply to the current level, suggesting a broader bearish momentum likely over a multi-day or weekly timeframe (based on the visible price action and timeframe options like 1d). Volume is elevated at 537,848.41 million (likely in USDT terms), indicating high selling pressure. Key indicators include:
RSI(7): 29.61 (oversold territory below 30, signaling potential exhaustion of sellers and a possible short-term rebound).
RSI(14): 29.92 (similarly oversold).
MACD: -36.74, with DIF at -272.74 and DEA at -238.99 (bearish histogram, confirming downward momentum but potentially nearing a crossover if buying emerges).
Moving Averages: MA(5) at 978.20 and MA(10) at 1,170.42, both sloping downward, reinforcing the bearish trend.
Key Support and Resistance Zones
Based on visible chart levels, recent price action, and horizontal lines/labels:
Support Zones:
Immediate: $1,989.38 (24-hour low, a critical floor; a break below could accelerate selling toward $1,800–$1,820, as noted in recent market resets).
Psychological/Major: $2,000 (round number often acting as a magnet in volatile markets; holding here could stabilize price).
Lower: $1,800–$1,820 (potential extension based on the steep drop and analyst targets for generational resets); further downside risks to $1,000 or even $900 if liquidity thins and capitulation deepens.
Resistance Zones:
Immediate: $2,147.73 (24-hour high; reclaiming this could signal a corrective bounce).
Intermediate: $2,261–$2,500 (visible pullback levels on the chart; aligns with falling wedge patterns mentioned in analyses).
Major: $3,000–$3,340 (broader recovery target; breaking this would invalidate the downtrend channel and target $4,000+).
The chart's structure resembles a falling wedge, with weakening downside momentum (oversold RSI), but the overall trend remains bearish until a higher low forms.
Fundamental Analysis of Ethereum (as of February 11, 2026)
While the chart focuses on technicals, Ethereum's fundamentals remain robust despite the recent price crash from early-2026 highs (around $4,800) to ~$2,000, driven largely by external macro factors rather than network weaknesses. The drop appears tied to non-ETH-specific issues like geopolitical tensions, global economic uncertainty, rising U.S. yields, dollar strengthening, and tighter monetary policy under the Federal Reserve. Massive liquidations exceeded $2.5 billion in one day, including a prominent "10/10 whale" who lost $110 million on a ~700 million ETH long position, exacerbating the sell-off through forced unwinds and thin liquidity. Institutional outflows were significant, with $79 million from ETH ETFs in a single day, alongside broader risk-off moves across crypto, tech, and growth assets.
However, positive on-chain metrics signal resilience and potential recovery:
Whale Accumulation: Large holders added ~4 million ETH in January 2026, increasing their supply from 101.18 million to 105.16 million—a stark contrast to last year's distribution.
Network Activity: Stablecoin transactions on Ethereum surged 200% over the past 18 months, indicating growing utility despite the price decline. Validator queue exceeds 4 million ETH, pointing to strong staking demand.
Upcoming Catalysts: Potential BlackRock ETF staking decision, Glamsterdam upgrade in H1 2026, AI-agent integration as the next hype cycle, and a 54% Polymarket probability for the Digital Asset Market Clarity Act being signed (summer 2026), which could boost institutional adoption and real-world asset (RWA) tokenization.
Sentiment Indicators: MVRV Z-Score at -0.42 signals capitulation (undervaluation), and Net Unrealized Profit/Loss (NUPL) suggests selling pressure is exhausting. Fear & Greed Index at "Extreme Fear" (14) often precedes bottoms.
Historically, February has a median +15% return since 2016, offering hope for a rebound after January's -7% (defying its +32% median). Analysts like Leshka project 3x–4x upside in six months via supply squeezes, while others like Michaël van de Poppe view the flush to $1,820 as a "generational reset" buying opportunity. BitMine's Tom Lee added $42 million in ETH amid the dip, underscoring institutional confidence.
Spot Signal for ETH
Buy (with caution for short-term volatility). The combination of oversold technicals (RSI <30), exhausted selling from macro-driven liquidations, and strong fundamentals (whale buying, rising on-chain utility, regulatory tailwinds) suggests ETH is undervalued at ~$2,000 and poised for a relief rally. Enter near support ($1,989–$2,000) targeting initial resistance at $2,147–$2,500, with a longer-term push to $3,000+ if ETF flows stabilize post-February 12. Stop-loss below $1,989 to protect against deeper capitulation. This is not financial advice—DYOR and consider market risks.