1️⃣ Short-Term (Intraday / 1H – 6H Charts)
Price Range: $67,500 – $70,500
Trend: Sideways / slight bullish potential
Indicators:
RSI (1H): ~43 → neutral, slight bearish fatigue
MACD (1H): negative, momentum weak
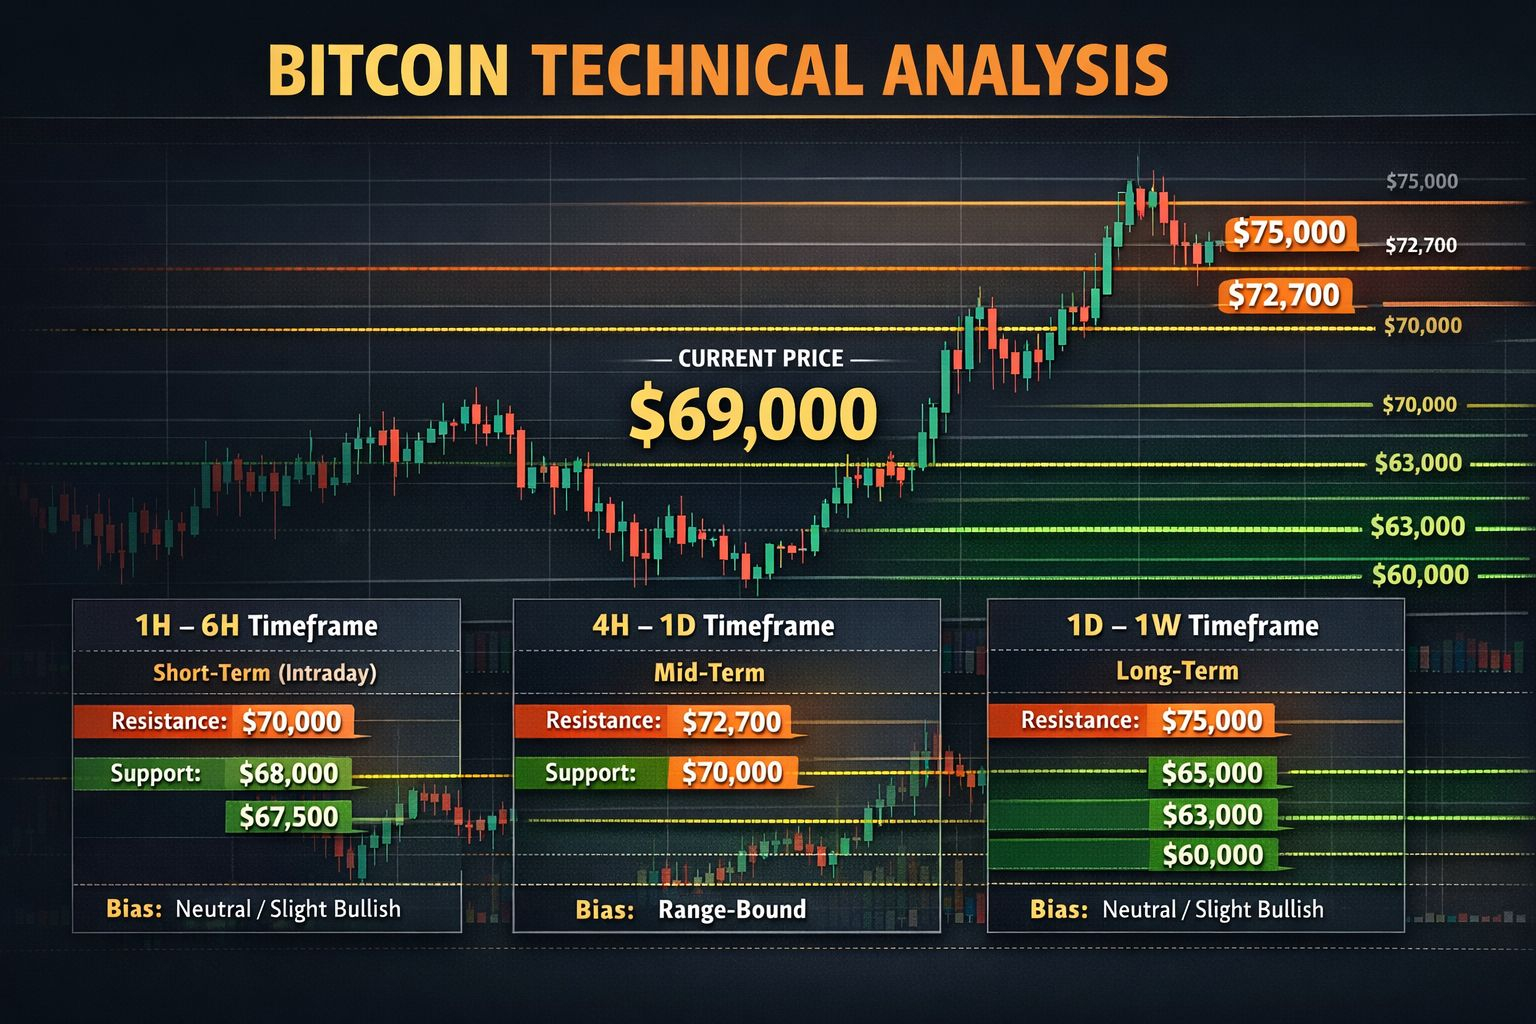
Support: $68,000 → immediate dip-buy area
Resistance: $70,000 → psychological barrier for breakout
Trading Tip: Wait for breakout above $70k or pullback to $68k for short-term scalping opportunities.
2️⃣ Mid-Term (4H – Daily Charts)
Price Range: $65,000 – $72,700
Trend: Neutral / range-bound
Indicators:
RSI (4H): 43 → not overbought, can test higher
MACD (4H): below signal line → needs crossover to confirm bullish trend
SMA50 (4H): ~$70k → resistance zone
SMA200 (Daily): ~$69,500 → crucial barrier
Support Levels:
$67,500 – $68,000 → first mid-term support
$65,000 → major floor for mid-term
Resistance Levels:
$70,000 – $70,500 → near-term mid-term resistance
$71,300 – $72,700 → strong selling zone
Trading Tip: For swing trading, watch break & close above $72k on 4H candle for bullish entry, or break below $65k for short positions.
3️⃣ Long-Term (Daily – Weekly Charts)
Price Range: $62,500 – $75,000+
Trend: Slightly bullish if $70k holds; otherwise, range-bound or corrective
Indicators:
RSI (Daily): 43 → neutral, room to move up
MACD (Daily): negative → no confirmed bullish crossover yet
SMA50 (Daily): ~$70k → key trend level
SMA200 (Weekly): ~$68k → strong historical support
Support Levels:
$65,000 – $63,000 → mid-term accumulation zone
$60,000 → critical long-term floor
Resistance Levels:
$72,700 – $75,000 → higher-timeframe breakout
$78,000+ → long-term bullish target if momentum strengthens
Trading Tip: Long-term traders should monitor $65k–$70k support zone. Accumulation near these levels is safer for swing or position trades.
📌 Multi-Timeframe Summary Table
TimeframeSupportResistanceBias1H – 6H$68k$70kNeutral-Slight Bullish4H – Daily$67.5k – $65k$70k – $72.7kNeutral / Range-BoundDaily – Weekly$65k – $60k$72.7k – $75kNeutral-Slight Bullish
📊 Key Observations
BTC is in range-bound consolidation on short and mid-term charts.
Momentum indicators are neutral-to-slightly bearish, but support zones offer potential bounce opportunities.
A sustained close above $70k (1H/4H/Daily) with volume will confirm bullish momentum for higher targets ($72k – $75k).
Breakdown below $65k could trigger short-term corrections toward $62k – $60k.
