$BTC The Market Is Speaking — Are You Listening?
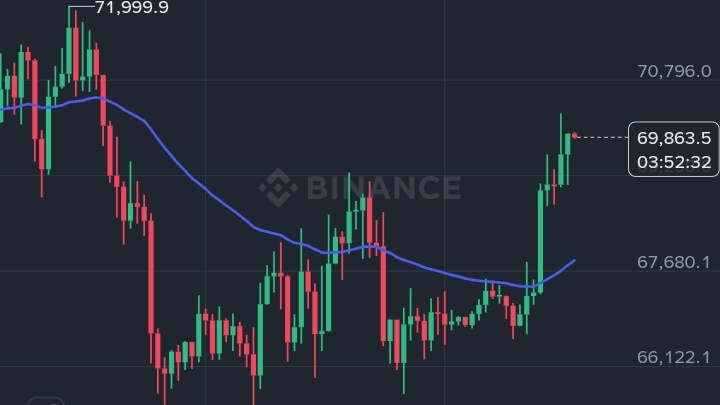
Bitcoin is once again heating up, printing strong bullish candles and reclaiming momentum near the $69,800 zone. After a period of consolidation and weak structure, the market is now showing signs of aggressive buyer interest.
But here’s the real question ➜
Is this the start of a sustained breakout… or just another liquidity trap before a reversal?
Let’s break it down technically
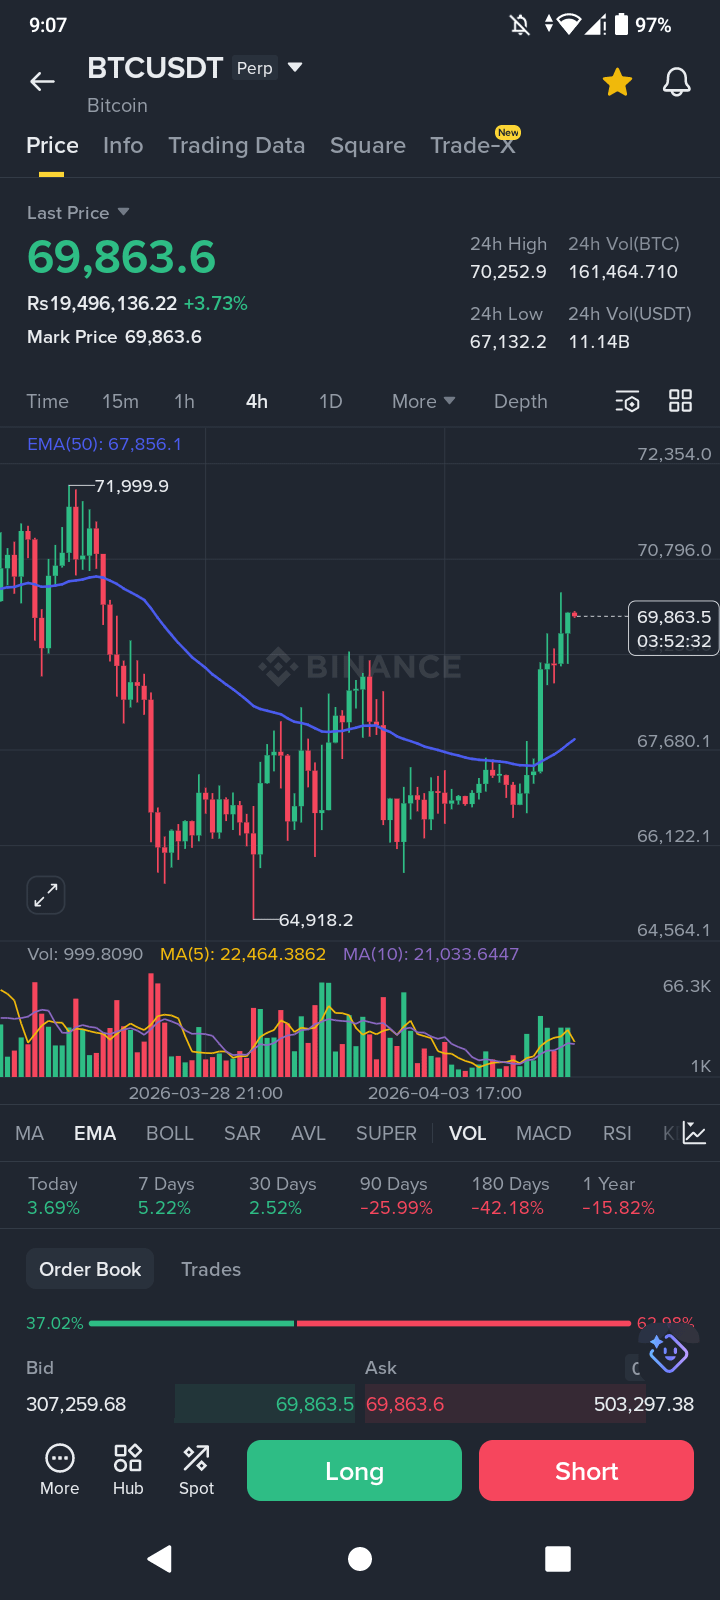
◆ Market Structure & Trend Analysis (4H Timeframe)
✔︎ Trend Shift Observed
BTC has transitioned from a downtrend → sideways accumulation → bullish expansion
Formation of higher lows + higher highs confirms short-term bullish structure
✔︎ Key Breakout Zone
Resistance around $68,700 – $69,000 has been flipped into support
Current price holding above this zone signals strength
The structure favors bulls as long as price holds above this flipped support.
◆ Moving Average (MA50) Insight
✔︎ MA(50): ~$67,400
Price is trading well above MA50
MA50 is curving upward → indicates trend continuation
➤ This acts as a dynamic support zone
➜ Any pullback toward MA50 could be a buy-the-dip opportunity
◆ Volume Analysis
✔︎ Volume is increasing during bullish candles
✔︎ Recent breakout backed by strong participation
➤ This confirms:
The move is not weak — buyers are actively in control
◆ RSI (Momentum Indicator)
✔︎ RSI(6): 91+ (Overbought)
✔︎ RSI(12): ~78
✔︎ RSI(24): ~63
➤ Interpretation:
Short-term → Overbought (possible pullback)
Mid-term → Still bullish
➜ Important: Overbought does NOT mean immediate reversal — it signals momentum is strong but stretched
◆ MACD (Trend Confirmation)
✔︎ MACD shows:
Strong bullish crossover
Expanding histogram bars
➤ This indicates:
Momentum is accelerating in favor of buyers
◆ Key Levels to Watch
Upside Targets
① $70,900 → Immediate resistance
② $72,700 → Major breakout zone
Support Levels
① $68,700 → Flipped support
② $67,400 (MA50) → Strong dynamic support
③ $66,600 → Last consolidation base
◆ Possible Scenarios
Bullish Scenario ✔︎
➜ If BTC holds above $68.7K
➜ Expect continuation toward $70.9K → $72.7K
Bearish Scenario ✔︎
➜ If price loses $68.7K support
➜ احتمال pullback toward $67.4K or lower liquidity zones
◆ Smart Trader Insight
✔︎ Don’t chase green candles blindly
✔︎ Wait for pullbacks or confirmation retests
✔︎ Market is currently momentum-driven, not safe-entry driven
➤ The biggest mistake?
Entering late when RSI is overheated
Momentum Is Strong — But Discipline Wins
Bitcoin is clearly showing bullish strength, supported by structure, volume, and indicators. However, the market is also entering overheated territory, where emotional decisions can lead to losses.
➜ Smart traders don’t follow hype — they follow levels, confirmations, and risk management.
◆ What do you think?
➤ Is BTC heading to $72K+ or preparing for a pullback?
✔︎ Drop your analysis in the comments
✔︎ Share this with fellow traders
✔︎ Follow for more high-probability setups

#BTCBackTo70K #AppleRemovesBitchatFromChinaAppStore #DriftInvestigationLinksRecentAttackToNorthKoreanHackers #AnthropicBansOpenClawFromClaude #USNFPExceededExpectations