Here is a technical analysis of the SOL/USDT 15-minute chart provided, along with key support and resistance levels to watch. Current Market Context
The price is currently trading at 89.23, experiencing a minor intraday decline of -3.18%. The chart shows a short-term bearish structure that is beginning to flatten out into a consolidation phase.
## Technical Indicators Breakdown
### Moving Averages (EMA)
The price is currently wedged tightly between its short-term Exponential Moving Averages:
* EMA(9) (Green line): 89.19
* EMA(25) (Purple line): 89.26
The price is printing just above the 9 EMA but remains capped by the 25 EMA. A clean breakout above 89.26 is needed to shift the immediate 15-minute momentum back to the upside.
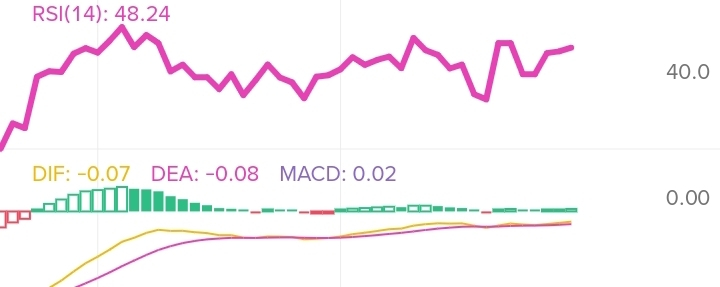
### RSI (Relative Strength Index)
The RSI(14) is sitting at 48.24. This is a neutral reading, showing that the previous downward momentum has cooled off, and the market is currently searching for direction. It is neither overbought nor oversold.
### MACD (Moving Average Convergence Divergence)
The MACD shows a slight bullish stabilization. The MACD line has crossed just above the signal line (DIF: -0.07, DEA: -0.08), and the histogram is printing small green bars (0.02). This hints at minor buying pressure building, though it lacks strong volume to drive a sharp reversal yet.
## Support and Resistance Levels
Based on the recent swing highs, swing lows, and indicator geometry on the chart, here are the key structural levels:
### Resistance Levels (Upside Targets)
* Immediate Resistance: 89.26 (Confluence of the 25 EMA. Breaking this is the first step for bulls).
* Strong Resistance: 89.65 - 89.85 (A previous consolidation zone where the price broke down heavily).
* Major Resistance: 90.09 (The recent local peak visible on the chart).
### Support Levels (Downside Protection)
* Immediate Support: 89.10 - 88.94 (The recent cluster of candle wicks where buyers stepped back in).
* Major Support: 88.70 (The absolute local low on this timeframe. A break below this would signal a continuation of the bearish trend).
## Trading Outlook
The trend is currently sideways-to-bearish but stabilizing.
If the price manages to hold above 89.10 and breaks past 89.26, expect a slow move back up toward the 89.65 region. Conversely, if sellers push the price below 88.94, a retest of the major 88.70 floor is highly likely.