Based on the 15-minute SOL/USDT chart you uploaded, the market is currently experiencing a short-term bearish correction after hitting a local peak at **85.80**. Price action is hovering near a key support level, and the indicators suggest momentum is currently leaning to the downside, but approaching an area where buyers might step back in.
Here is a technical breakdown of where you could look to buy and sell based on this setup.
### 1. Buying Scenarios (Entry Zones)
* **Scenario A: Support Retest (Aggressive Entry)**
* **Zone:** **84.00 – 84.10**
* **Reasoning:** The chart shows a strong recent bounce from **84.08**. If the price drops slightly lower to retest this level and holds, it forms a double-bottom pattern on this timeframe, which is a classic bullish reversal sign.
* **Scenario B: Trend Reversal Confirmation (Safer Entry)**
* **Zone:** Wait for a breakout above **85.00**
* **Reasoning:** Currently, the EMA(9) (green line) has just crossed below the EMA(25) (purple line), which is a bearish signal. Waiting for the price to reclaim 85.00 and seeing the green line cross back *above* the purple line confirms that the upward momentum has returned.
### 2. Selling Scenarios (Exit Zones)
* **Scenario A: Short-Term Target (Take Profit 1)**
* **Zone:** **85.00 – 85.15**
* **Reasoning:** This area acts as local psychological resistance and lines up with where the moving averages are currently converging. Expect some selling pressure here.
* **Scenario B: Local Peak Target (Take Profit 2)**
* **Zone:** **85.70 – 85.80**
* **Reasoning:** This is the recent high. If momentum carries past 85.15, this is the logical next major resistance where buyers took profit previously.
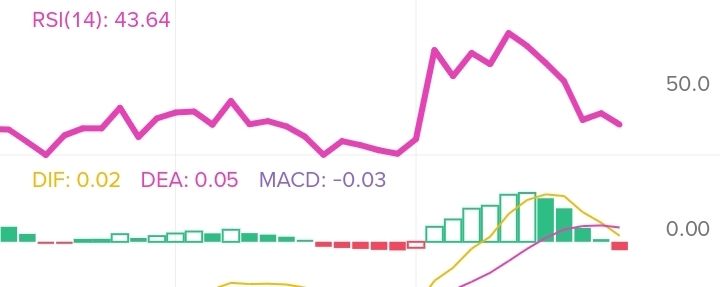
### What the Indicators Are Saying Right Now
* **RSI (14):** Sitting at **43.64**. It is below the neutral 50 line, indicating bearish control in the immediate short term, but it is not yet "oversold" (which would be below 30). There is still a bit of room for a minor downside before a bounce.
* **MACD:** The MACD histogram bars have turned red and are moving below the zero line, while the signal lines are crossing downward. This confirms that the current 15-minute trend is down, so patience before clicking "Buy" might reward you with a slightly lower price.
### Risk Management Note
If you decide to enter a trade near the **84.08** support, a tight stop-loss placed just below that level (e.g., around **83.80**) can help protect your capital in case the market breaks down toward the 24-hour low of 83.50.