
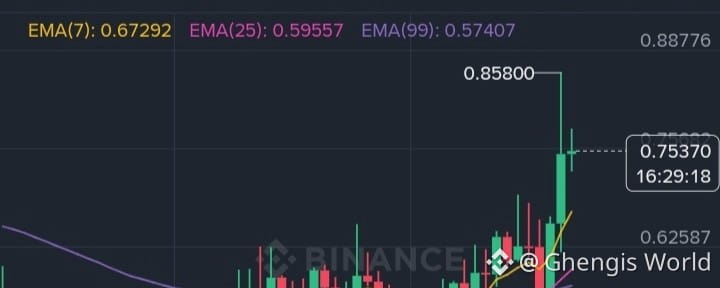
BEATUSDT Technical Analysis & Trading Strategy (1D Chart)
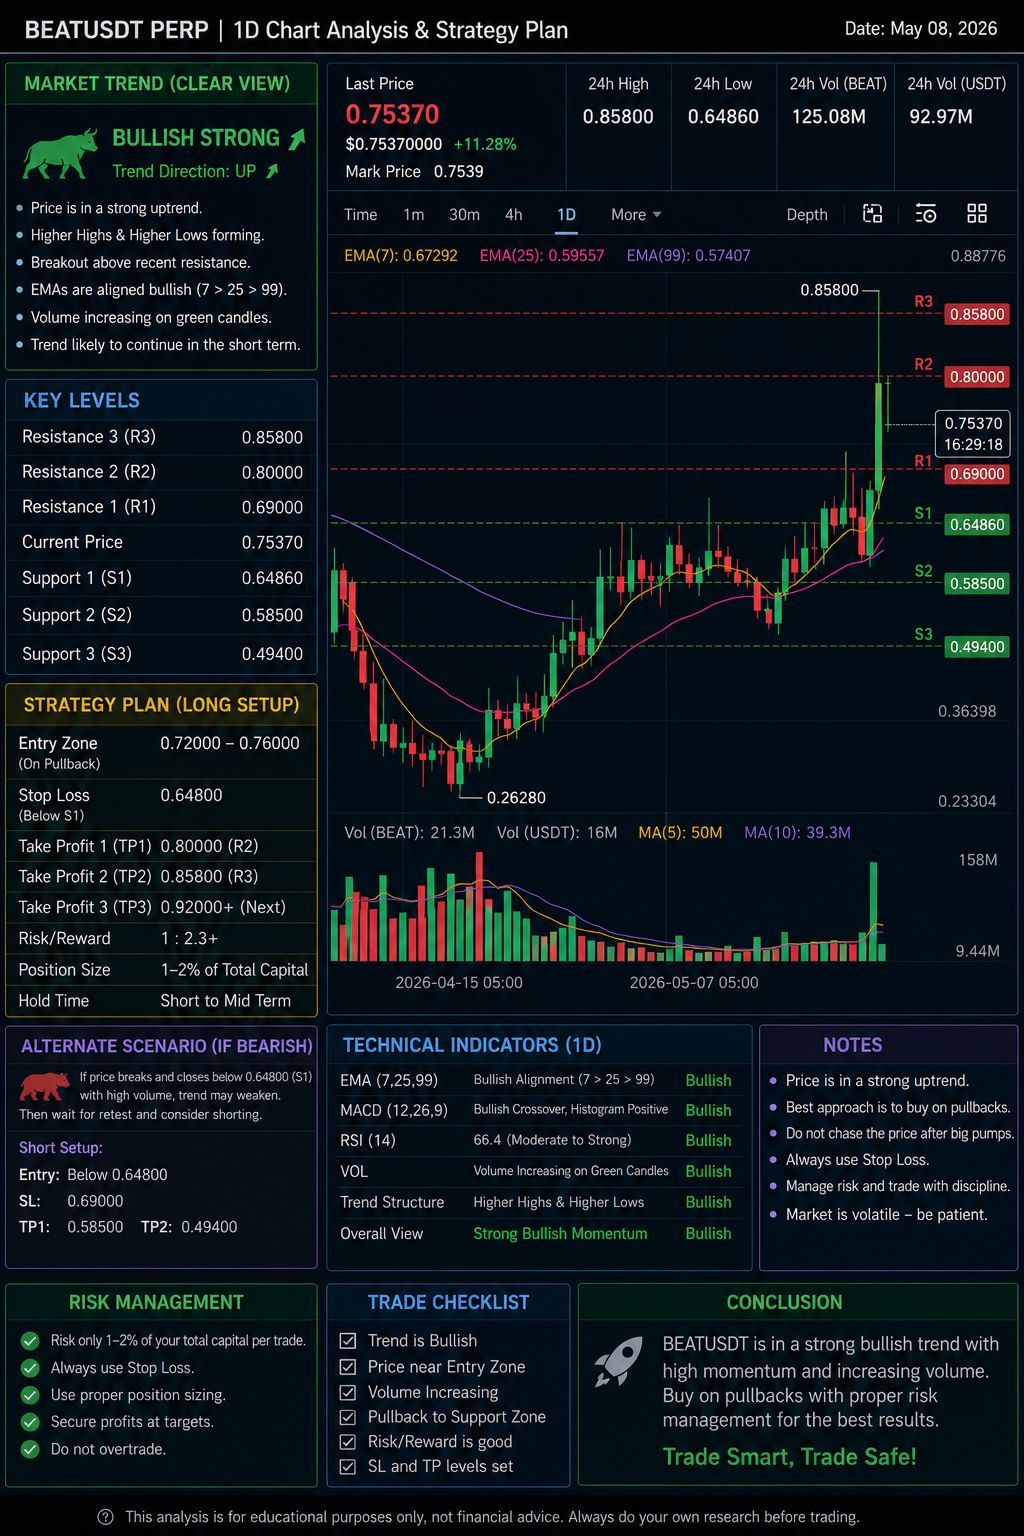
BEATUSDT Market Overview
The BEATUSDT Perpetual market is currently showing a strong bullish structure on the 1-Day timeframe. The chart reflects a major recovery from lower levels, followed by a breakout supported by increasing volume and bullish EMA alignment.
The recent explosive candle movement indicates that buyers are actively dominating the market. Momentum has increased significantly, and the trend structure suggests that the market is attempting to continue higher after breaking previous resistance zones.
Current market data:
Current Price: 0.7537
24H Change: +11.28%
Daily High: 0.8580
Daily Low: 0.6486
The overall trend currently remains bullish unless key support zones are broken.
Market Trend Analysis
Overall Trend: STRONG BULLISH
The market structure clearly indicates bullish momentum because:
Price is forming Higher Highs & Higher Lows
EMA 7 is above EMA 25
EMA 25 is above EMA 99
Strong bullish candles are supported by volume
Breakout above recent consolidation resistance is visible
The EMA alignment confirms trend continuation strength.
Current EMA structure:
This setup is commonly seen during strong bullish continuation phases.
Volume Analysis
Volume activity is one of the strongest confirmations on this chart.
The chart shows:
Large increase in buying volume
Strong green candles with momentum
Institutional-style breakout movement
Rising market participation
When price and volume rise together, it usually confirms genuine bullish interest rather than a weak temporary pump.
However, after strong vertical moves, markets often experience short-term pullbacks before continuing upward.
Key Support & Resistance Levels
Resistance Zones
Resistance LevelPriceR10.6900R20.8000R30.8580
The major resistance currently sits near 0.8580, which is the recent high shown on the chart.
If buyers break above this level with strong volume, further upside expansion may occur.
Support Zones
Support LevelPriceS10.6480S20.5850S30.4940
These levels may act as strong retracement and accumulation zones during market pullbacks.
Trading Strategy Plan
Preferred Setup: LONG POSITION
The current market structure favors bullish continuation strategies.
Entry Zone
Best buying area:
0.7200 – 0.7600
Ideal entry conditions:
Small retracement
Bullish candle confirmation
Support retest
Stable volume behavior
Avoid emotional entries after large breakout candles.
Stop Loss Placement
Recommended Stop Loss:
Below 0.6480
This level invalidates the bullish structure if broken aggressively.
Take Profit Targets
Profit Targets
Take ProfitPriceTP10.8000TP20.8580TP30.9200+
If bullish momentum continues, the market could attempt higher expansion toward psychological resistance zones.
RSI & Momentum Analysis
Momentum indicators currently suggest strong buyer activity.
The chart behavior indicates:
Bullish momentum remains active
Trend continuation probability is high
Market sentiment is positive
However, traders should understand that:
Fast rallies can create volatility
Pullbacks are natural in trending markets
Overleveraging during hype periods is risky
Patience and disciplined entries remain important.
Alternate Bearish Scenario
Despite bullish strength, risk management is essential.
Bearish confirmation would appear if:
Price closes below 0.6480
Selling volume increases sharply
EMA 7 crosses below EMA 25
If bearish pressure increases, the market may revisit:
0.5850
0.4940
Until then, bulls remain in overall control.
Risk Management Strategy
Professional traders focus more on protecting capital than chasing profits.
Recommended trading rules:
Risk only 1–2% per trade
Use proper Stop Loss placement
Never chase pumps emotionally
Secure partial profits at targets
Avoid excessive leverage
Long-term survival in trading depends on disciplined risk management.
Final Decision ⁉️
BEATUSDT is currently showing a powerful bullish trend on the daily timeframe. The breakout is supported by:
Strong volume
Bullish EMA alignment
Higher highs formation
Momentum continuation structure
The best approach in current conditions is:
Buy on pullbacks
Follow the trend direction
Avoid FOMO entries
Protect capital with Stop Loss
Scale profits gradually
If momentum remains strong, the market may continue moving toward:
0.8000
0.8580
0.9200