
RIVERUSDT Fundamental Analysis & Market Outlook (2026)
Introduction
RIVERUSDT is currently showing signs of stabilization and gradual bullish recovery after experiencing a major long-term downtrend. The chart structure indicates that selling pressure has weakened significantly, while buyers are slowly regaining market control.
From a fundamental perspective, this type of market behavior often appears when:
Fear and panic selling decrease
Market accumulation begins
Volume starts stabilizing
Investor confidence slowly returns
Bitcoin and overall crypto market sentiment improves
Although the asset is still below its historical highs, the current structure suggests that the market may be entering an early recovery phase rather than continuing aggressive downside movement.
Current Market Condition
Market Structure: Recovery Phase
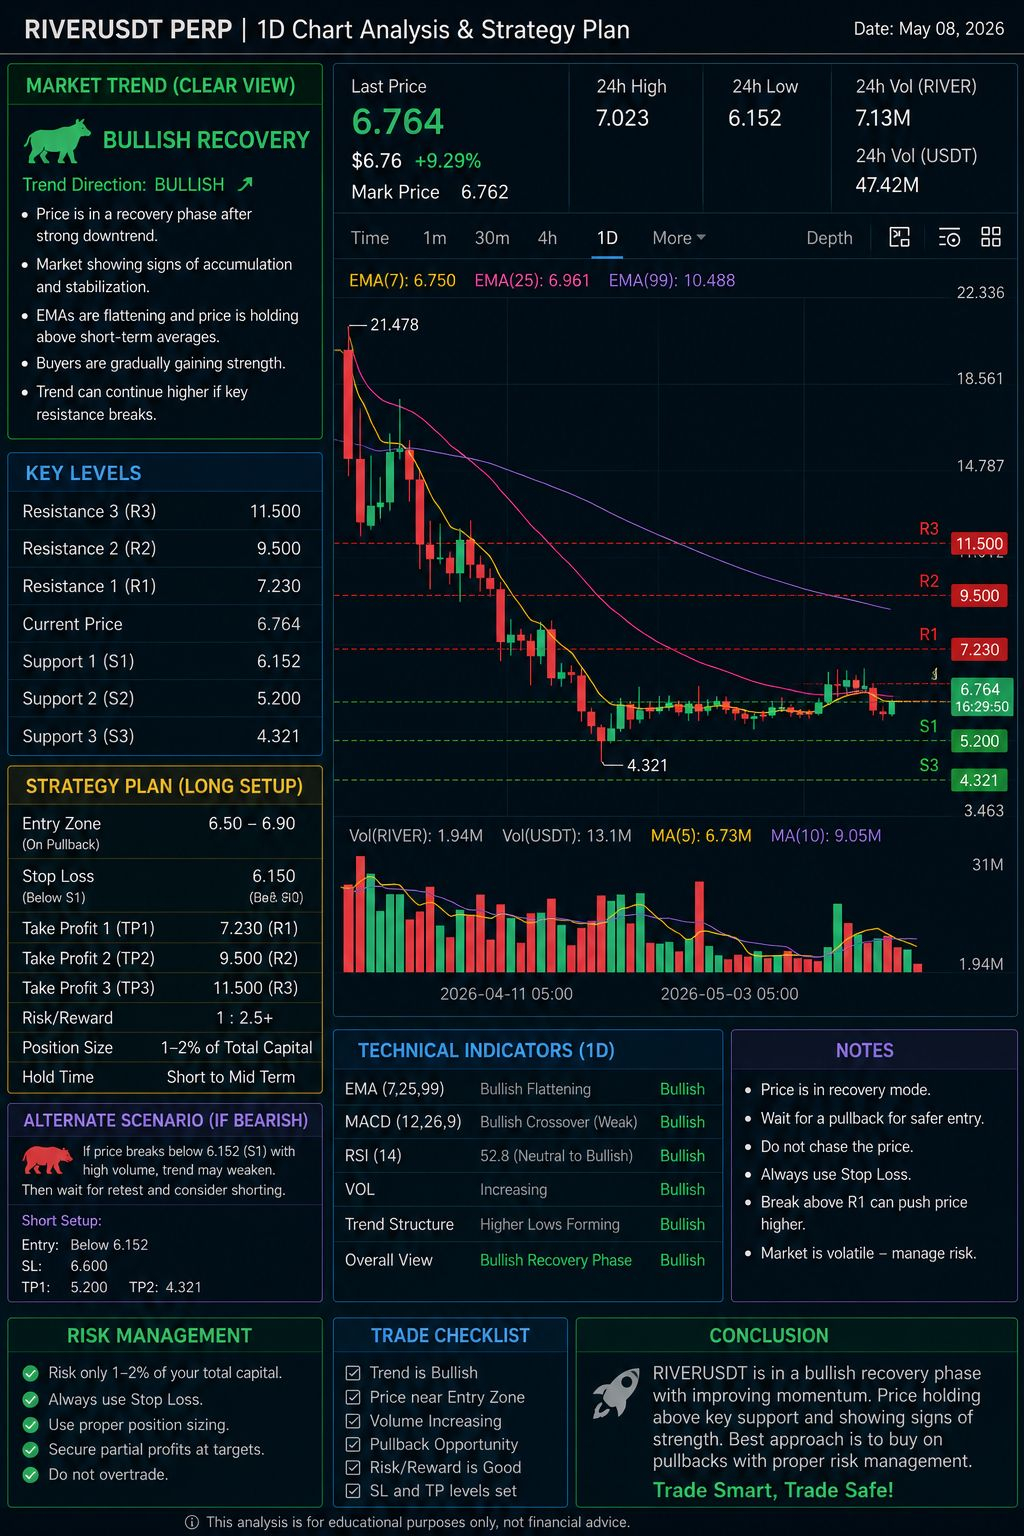
The chart clearly reflects three major stages:
Strong bearish decline
Sideways accumulation
Early bullish recovery
This recovery structure is important because markets usually do not reverse instantly after large crashes. They first enter consolidation phases where smart money and long-term investors begin accumulating positions quietly.
Current market price:
Current Price: 6.764
24H High: 7.023
24H Low: 6.152
The market is now attempting to build strength above important support zones.
Fundamental Strength Analysis
1. Market Stabilization
One of the most positive signs visible on the chart is stabilization after prolonged weakness.
This indicates:
Sellers are losing momentum
Panic dumping has reduced
Buyers are defending support levels
Market volatility is becoming more controlled
When markets stop making lower lows repeatedly, it often becomes the first signal of possible long-term recovery.
2. Volume Behavior
Trading volume is a key factor in fundamental recovery analysis.
The chart shows:
Volume spikes during bullish candles
Improved participation near support
Gradual increase in buyer activity
This suggests that investor interest is slowly returning to the market.
Strong recoveries usually begin with:
Accumulation
Stable volume
Slow trend reversal
Gradual breakout attempts
RIVERUSDT appears to be entering this stage.
3. EMA Structure & Recovery Trend
The EMA indicators show that short-term momentum is improving.
Current structure:
EMA 7 near current price
EMA 25 flattening
Price attempting recovery above short-term averages
This indicates:
The long-term trend is still recovering, but short-term momentum is improving.
This type of EMA behavior often appears during:
Bottom formation
Recovery accumulation
Trend transition periods
4. Investor Psychology
Fundamental recovery is also heavily connected with market psychology.
After major declines:
Weak hands exit the market
Long-term holders begin accumulating
Fear slowly turns into optimism
Early buyers position themselves before major breakout phases
The current chart suggests that traders are beginning to regain confidence, especially as price continues holding above key support zones.
Important Fundamental Levels
Resistance Zones
LevelImportance7.230First breakout confirmation9.500Major recovery resistance11.500Long-term bullish reversal zone
A successful break above these levels could attract stronger investor attention and additional market momentum.
Support Zones
LevelImportance6.152Main short-term support5.200Accumulation support4.321Major historical support
As long as price remains above key support areas, the recovery structure remains valid.
Macro Crypto Market Influence
Like most altcoins, RIVERUSDT is also influenced by the broader crypto market.
Its future direction will likely depend on:
Bitcoin market strength
Altcoin sector rotation
Global crypto sentiment
Liquidity entering the market
Investor risk appetite
If the overall crypto market enters a bullish expansion cycle in 2026, recovery-focused projects like RIVERUSDT may benefit significantly.
Risks Investors Should Understand
Despite improving conditions, risks still exist.
Important concerns include:
Overall crypto market volatility
Possible fake breakouts
Low liquidity periods
Sudden Bitcoin corrections
Resistance rejection zones
Recovery markets can remain volatile before full trend confirmation appears.
This is why proper risk management remains essential.
Long-Term Outlook
The chart currently suggests:
Downtrend momentum has weakened
Recovery accumulation is active
Buyers are defending support
Market sentiment is gradually improving
If bullish momentum continues and resistance levels break successfully, RIVERUSDT could enter a stronger medium-term recovery phase.
However, confirmation requires:
Higher trading volume
Strong breakout candles
Stable market sentiment
Continued higher lows formation
Final Decision ⁉️
RIVERUSDT currently appears to be in a bullish recovery phase after a prolonged bearish cycle. Fundamentally, the market is showing:
Stabilization
Accumulation behavior
Improving momentum
Gradual buyer strength
Better support holding
The project still faces resistance challenges, but the overall structure suggests recovery potential rather than continued collapse.
For traders and investors, the smartest approach is:
Watch support zones carefully
Wait for confirmed breakouts
Avoid emotional trading
Focus on risk management
Follow overall crypto market sentiment