


The structural bull market in gold has moved into a phase of hard consolidation after a parabolic overshoot. A meaningful portion of large holders has been rotating profits into other trades, and that steady outflow caps every rally attempt before it gains traction.
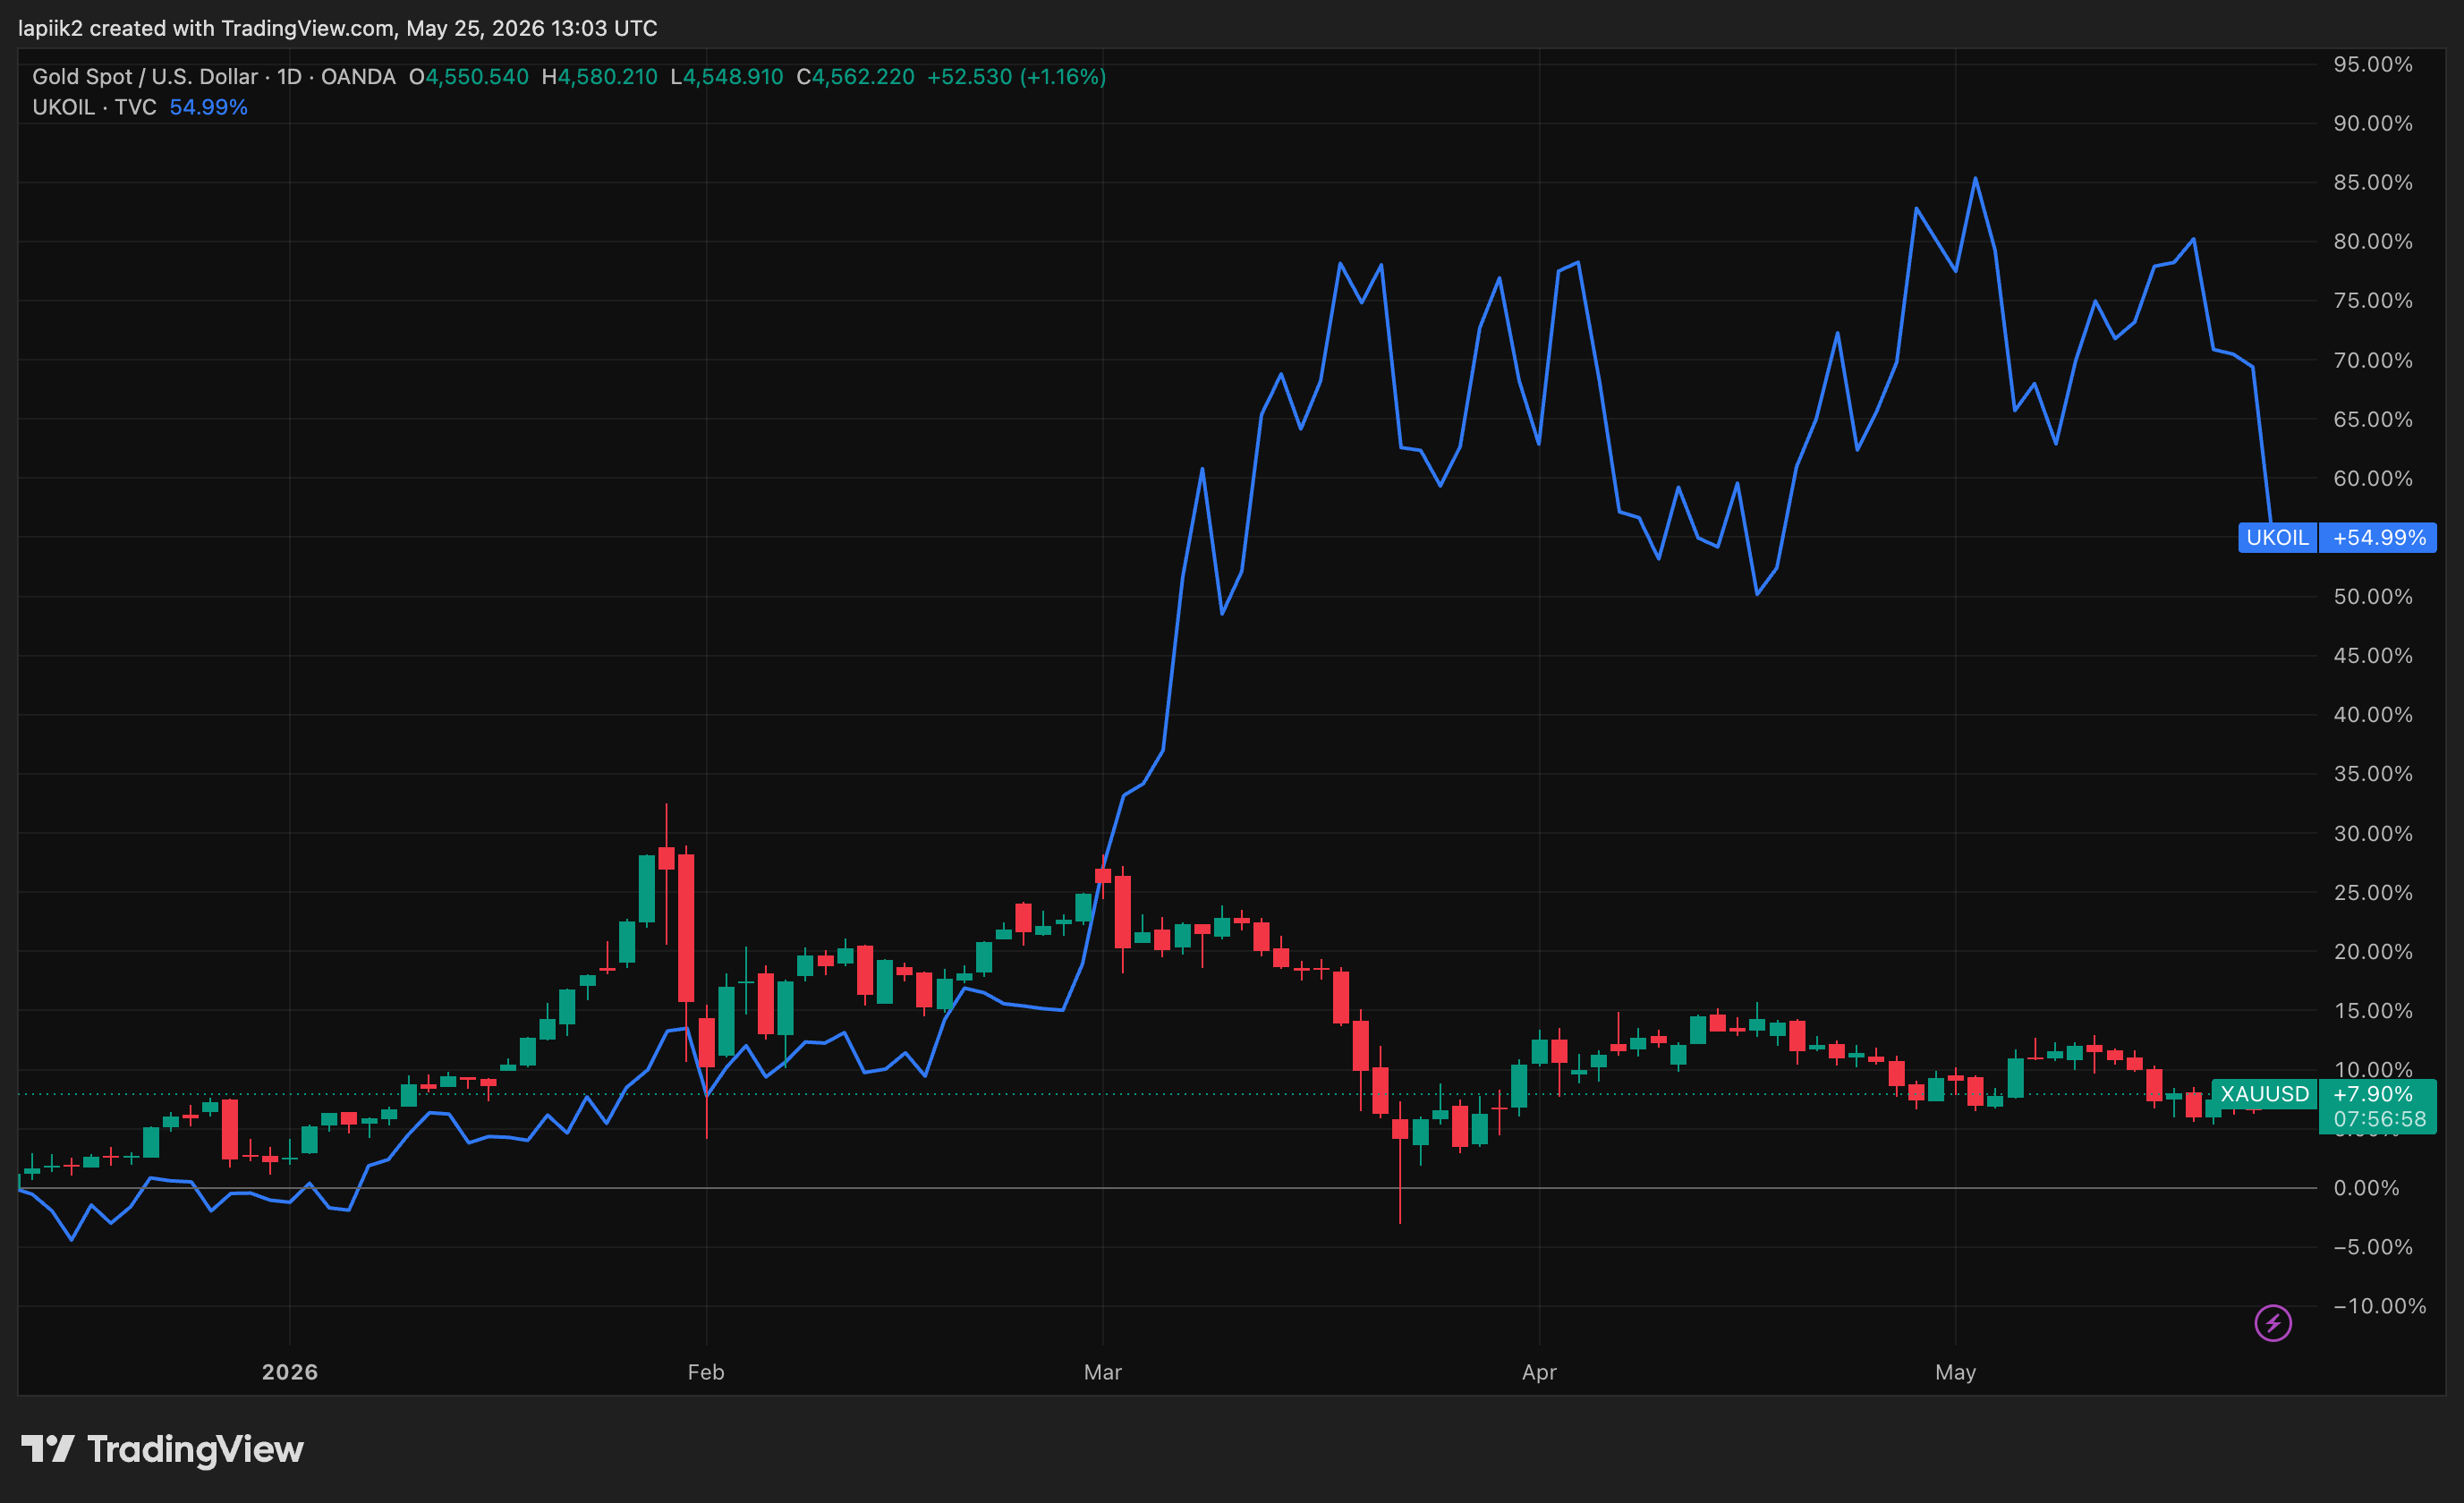
The most telling signal comes from the gold-oil relationship since the war began on February 28. Brent is up roughly 66% over that window while spot gold is down about 14%. In the prior regime this combination was simply impossible. Geopolitical shock used to lift both assets together.
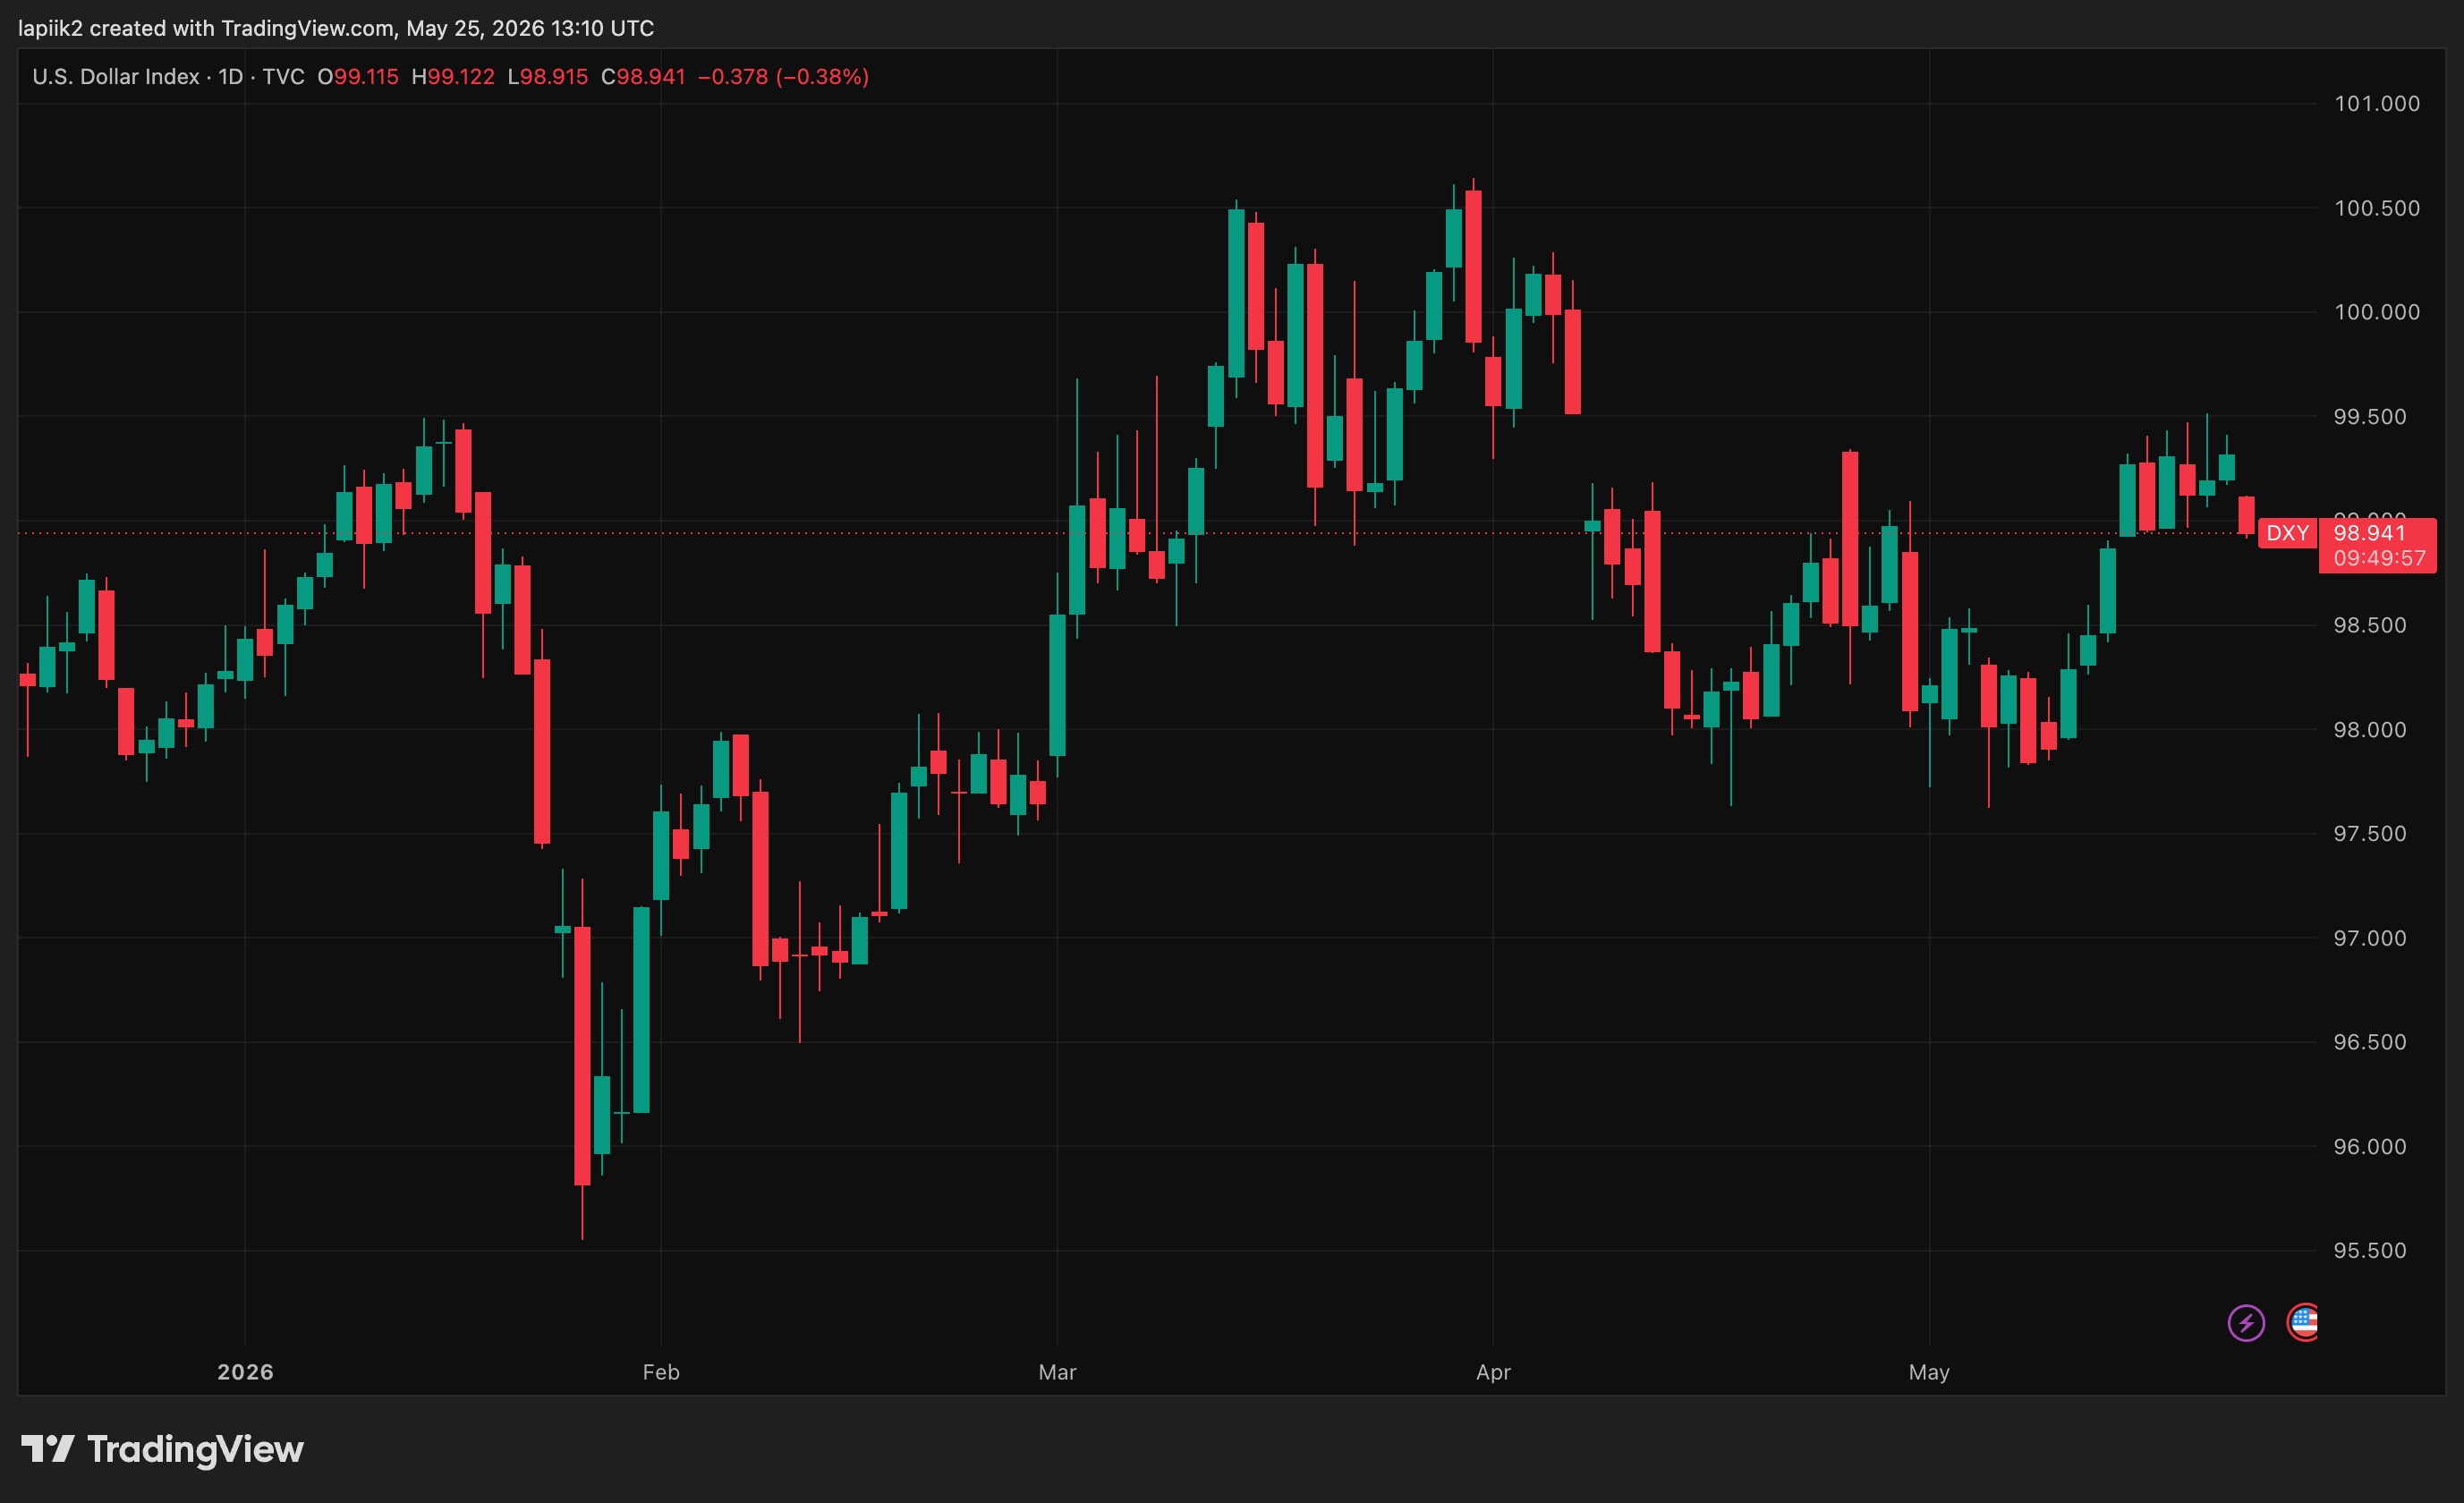
The mechanism has now flipped: rising oil feeds into inflation expectations, reprices the Fed path higher, strengthens the dollar, and raises the opportunity cost of holding a zero-yield asset. The probability of at least one Fed hike in 2026 has climbed to 58%.
Spot trades around $4,540 per ounce, down 14.6% from the January high of $5,318 but still up roughly 38% year on year. The gold-silver ratio sits at 59.4. Volatility has compressed sharply to four-month ATR lows. This is the look of a coiled spring, not a finished move.
After record North American ETF outflows of $12.7B in March, April reversed course with $6.6B in global inflows. Total holdings climbed back to 4,137 tonnes, the third-highest level on record. On COMEX, managed money net longs stand at around 100,600 contracts, roughly $45.7B of notional exposure.
The latest week showed a careful build of longs alongside a small reduction in shorts. Open interest at 545,000 contracts looks healthy with no obvious distortions. The Shanghai-London premium has held steady at $15-$20 per ounce, with LBMA vaults in London holding 9,372 tonnes at the end of April, worth around $1.4T. There are no signs of physical stress anywhere in the system.
The structural shifts rewriting the gold story
Central banks: still the base, no longer unconditional
Central banks bought 244 tonnes net in Q1, up 17% quarter on quarter and above the five-year average. But for the first time in this cycle, reported sales also became material at roughly 115 tonnes in the quarter, driven by Turkey, Russia, and Azerbaijan's SOFAZ. For sanctioned or currency-stressed issuers, gold has become a liquidity management tool rather than purely a reserve hedge.
Turkey is using gold swaps to manage FX needs. Russia is monetizing the gold portion of its sovereign wealth fund to cover the budget deficit. Meanwhile, committed buyers keep showing up: Poland added 31 tonnes in Q1 toward a 700-tonne target, and China bought 7 tonnes in Q1 plus another 8 in April, its 18th consecutive month of accumulation. PBoC holdings now stand at 2,322 tonnes, around 9% of total reserves. At $4,500 and above, official buyers are selective. They accumulate on dips rather than chase the price higher.
Asia is no longer a single bullish impulse
China remains the main physical engine, but with clear signs of slowing. Q1 net imports hit 316 tonnes, up 333% year on year, and March alone brought in 143 tonnes. April changed the tone: SGE withdrawals fell to 103 tonnes, down 23% month on month and 33% year on year. Chinese gold ETFs are in their eighth consecutive month of inflows, with $498M added in April.
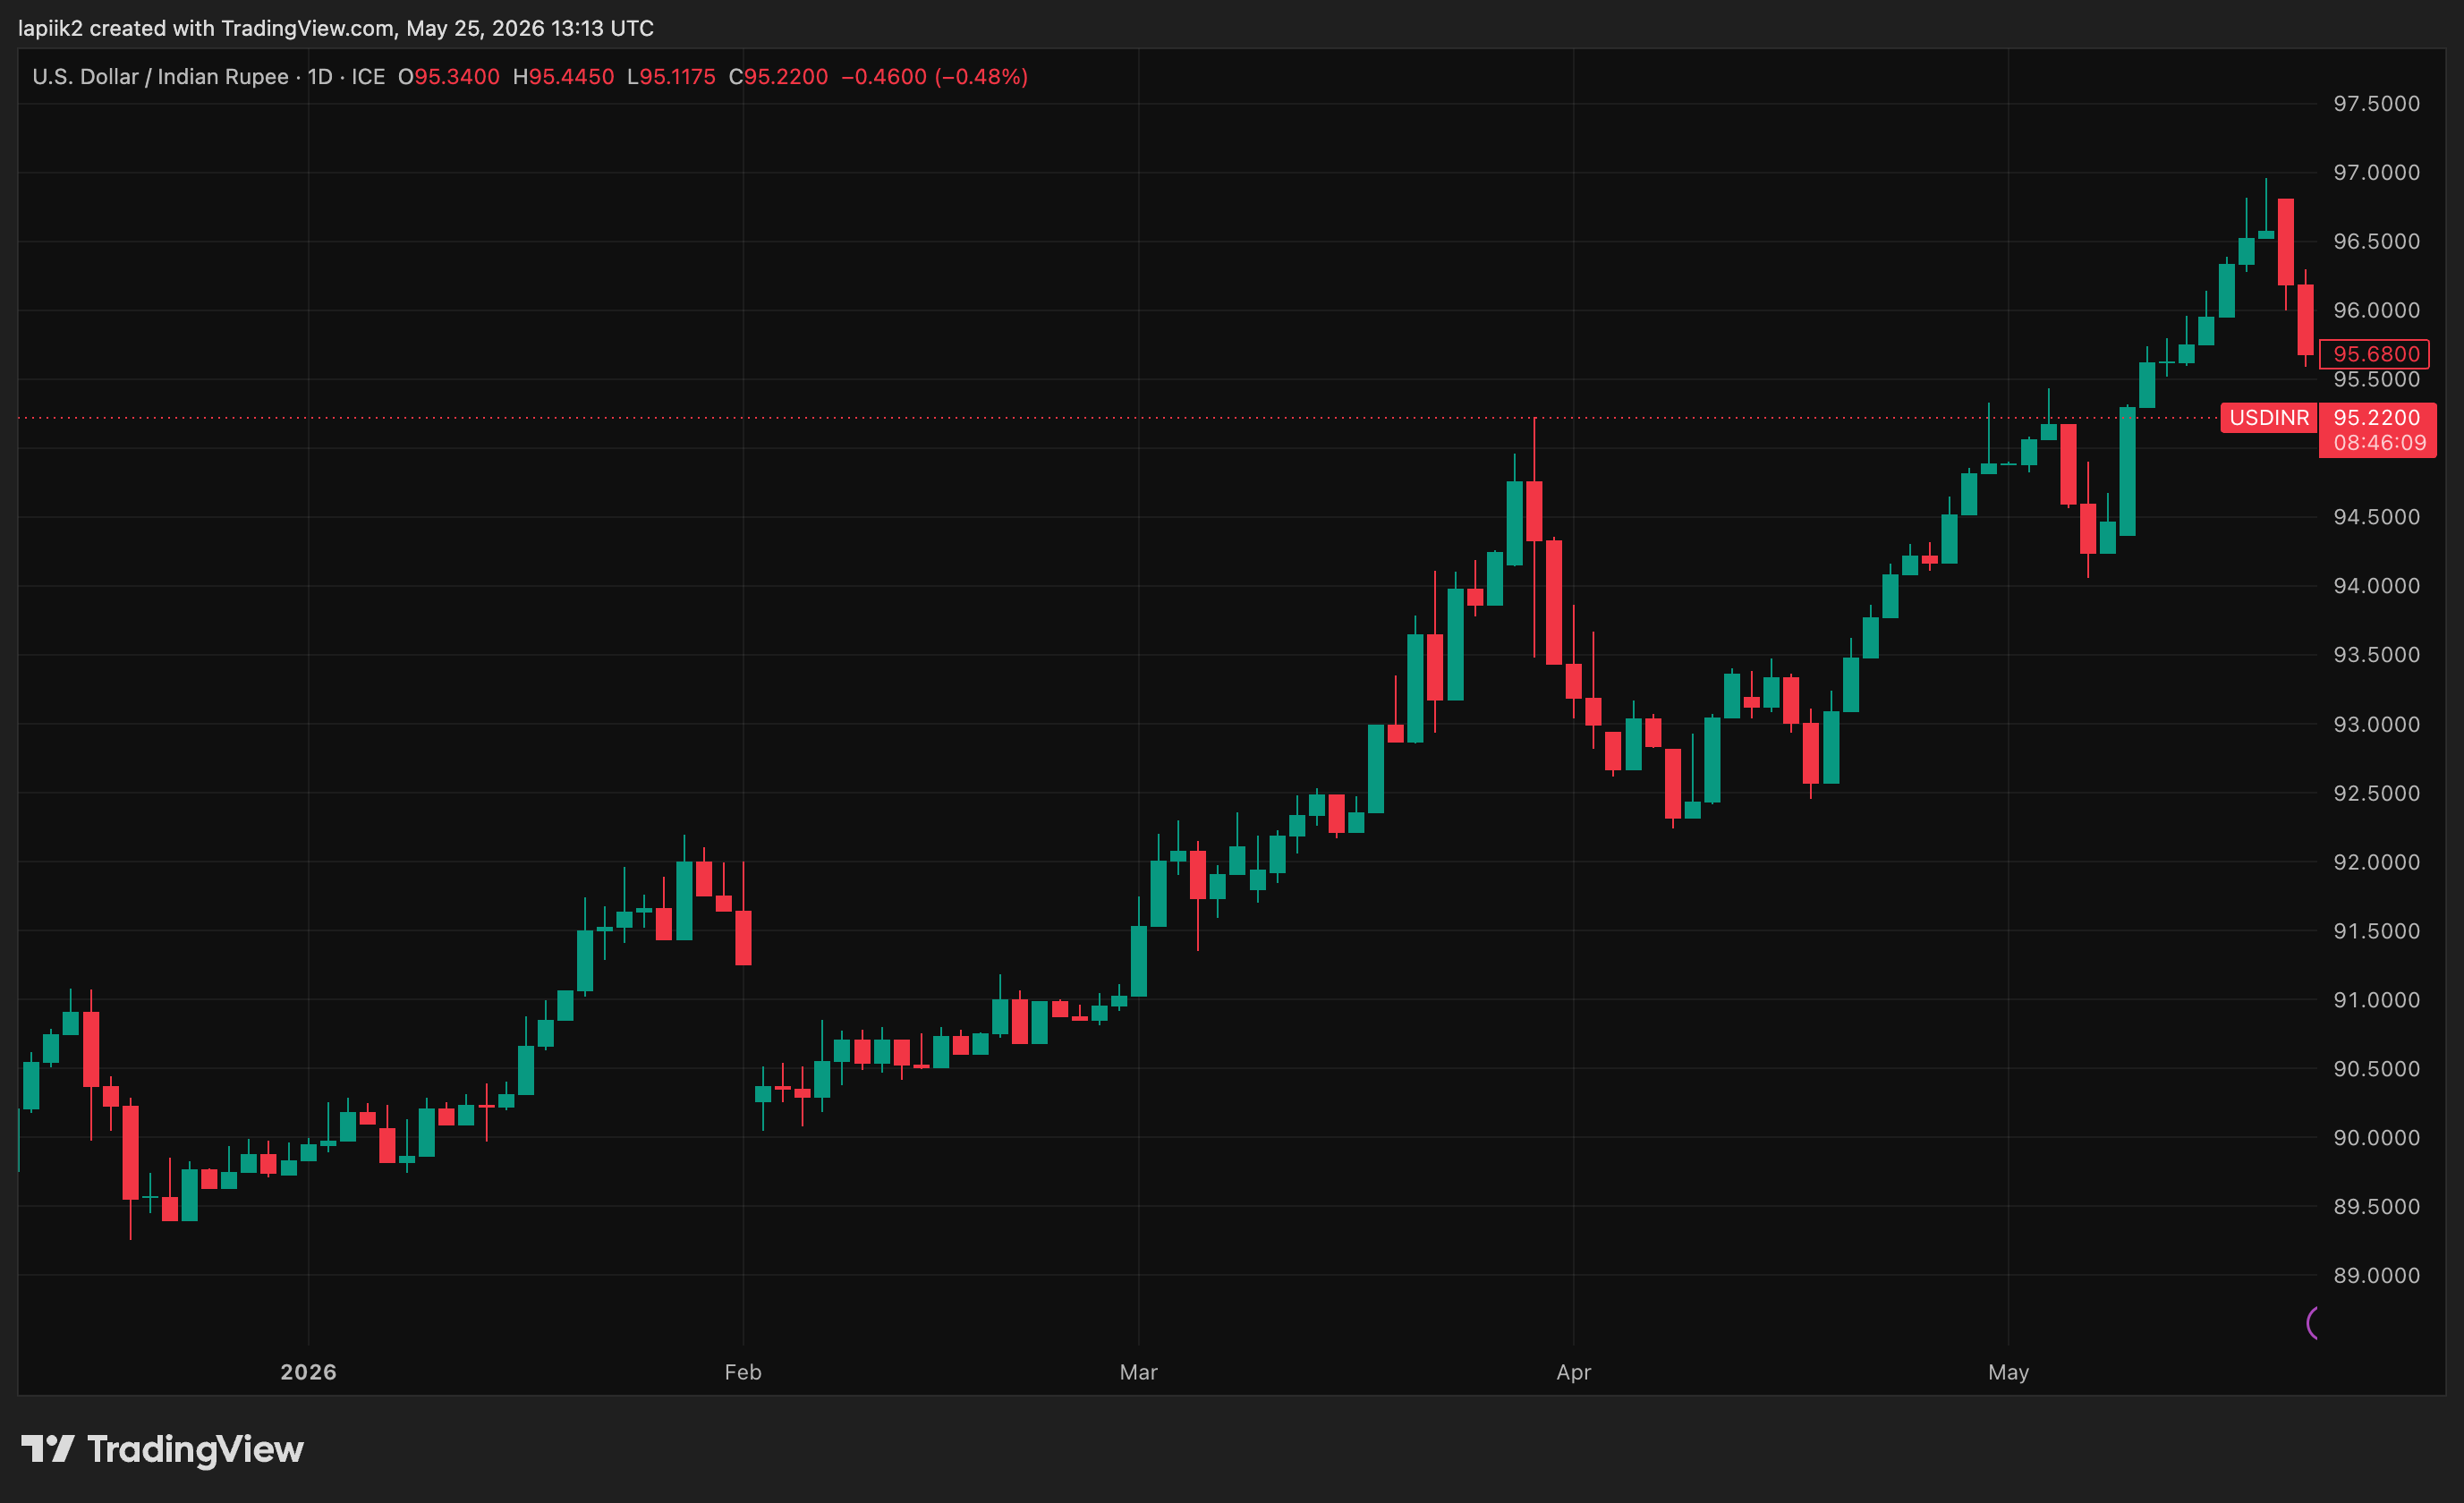
India is moving in the opposite direction with deliberate policy force behind it: import duties lifted from 6% to 15%, dealers offering record discounts of up to $207 per ounce, and scrap supply surging. The government is deliberately cooling the world's largest retail gold market to stabilize the rupee.
The Gulf reads best as a potential buyer in a deeper dollar-depreciation scenario, not an active defender of $4,500. The unified Asian bid that drove 2024 no longer exists.
Supply: the most underappreciated factor in the narrative
Total supply in Q1 grew by only 2% year on year at prices above $4,500. That is an extraordinarily weak response. Exploration capex was systematically underinvested between 2013 and 2020, and the major producers, Newmont, Barrick, and Agnico Eagle, are channeling windfall margins into dividends and buybacks rather than new projects.
Industry-wide all-in sustaining costs sit in the $1,500-$1,800 range, so margins are enormous, but management is choosing capital discipline over volume growth. Even at $4,000-$4,200, supply would not rise enough to create a surplus. That is the long anchor under the bull thesis on a 2027+ horizon.
Where prices go from here
The institutional consensus has drifted lower but stays constructive: JPMorgan at $5,243, Goldman at $5,400, UBS at $5,900-$6,200, with a consensus median near $5,300. Three scenarios define the range:
Base case (50%): $4,350-$4,900. China and central banks defend the floor, India and rates cap the upside, the Fed stays on hold through Q3.
Bull case (30%): $5,000-$5,600+. Falling real yields, softer dollar, renewed ETF inflows, and new sovereign buyers stepping in. Confirmation comes from a sustained close above $4,900.
Bear case (20%): $4,100-$4,300. Rising 10Y yields, a hawkish Fed pivot, deepening Indian discounts, and a return to ETF outflows. The trigger to watch is a loss of $4,350 on rising open interest.
Six things that matter now
At present, the marginal price setter on a weekly horizon has shifted to rates, the dollar, oil, ETF flows, and futures positioning, meaning that the PBoC no longer leads the market.
Simultaneously, the inversion of the gold-oil correlation during the Iran conflict broke one of the foundational assumptions of safe-haven allocation, which now forces a comprehensive portfolio rethink.
Furthermore, for a subset of central banks, gold has officially become a stress liquidity instrument, and this development introduces a structurally new source of supply that was entirely absent from 2022 to 2024.
Meanwhile, Asian demand has become bifurcated, as China supports the market with hesitation, India actively suppresses it, and other markets remain individually too small to compensate for these actions.
On the supply side, the situation is structurally inelastic because mining activity barely responds even to $4,500 prices, and that specific level remains the long anchor under the bull thesis for 2027 and beyond.
Regarding key levels, the $4,000–$4,200 range is where the Asian sovereign bid currently sits, the $4,400–$4,600 area represents the current zone of indecision, and a move above $4,900 confirms a new leg higher.
Conclusion
The gold market has entered a mature, institutional phase where the emotional geopolitical bids of the past have been replaced by strict macro discipline.
While the structural bull case remains intact through the end of the decade due to severe mining underinvestment and systematic central bank accumulation, the immediate upside is firmly capped. Higher-for-longer inflation, driven by oil, has effectively weaponized the Fed path and the US dollar against gold's zero yield.
As long as the market remains balanced between a hesitant China on the floor and a hawkish Fed at the ceiling, gold is locked in a tight, healthy consolidation. The immediate path forward is not a macro reversal, but a game of patience inside the $4,350 - $4,900 range, waiting for the macro spring to coil tightly enough before the next major breakout.