
Introduction
Most crypto traders watch price. Smart traders watch what's driving it.
Price alone doesn't tell you if a move is real or if it's just noise. That's where CVD comes in: one of the most powerful orderflow tools you can add to your analysis. Once you understand it, you'll never read a chart the same way again.
What is CVD?
CVD stands for Cumulative Volume Delta. It tracks the running difference between aggressive buying and aggressive selling over time.
When someone market buys (hits the ask) → positive delta
When someone market sells (hits the bid) → negative delta
CVD accumulates this continuously, giving you a real-time picture of who is in control — buyers or sellers.
Spot CVD vs Futures CVD
Not all CVD is equal. There are two types you need to know:
1) Spot CVD reflects real buying and selling of actual $BTC. This is genuine demand — someone is actually acquiring coins on the spot market.
2) Futures CVD reflects derivatives activity. This can be hedging, speculation, or noise. It is less reliable on its own.
The rule is simple: when spot CVD leads the move, it's real. Futures CVD alone can mislead you into thinking there's conviction behind a move when there isn't.
How to Read CVD — Never in Isolation
CVD only makes sense when compared to price action. Here are the four core readings:
1) Spot CVD ↑ + Price ↑ = Genuine buying. Strong move with real participation.
2) Spot CVD ↓ + Price ↑ = Divergence. Distribution. Someone is selling into the move.
3) Spot CVD ↑ + Price ↓ = Hidden bullish divergence. Limit buyers absorbing aggressive sell pressure.
4) Spot CVD ↓ + Price ↓ = Genuine selling. Trend continuation signal.
The Four Divergences That Matter
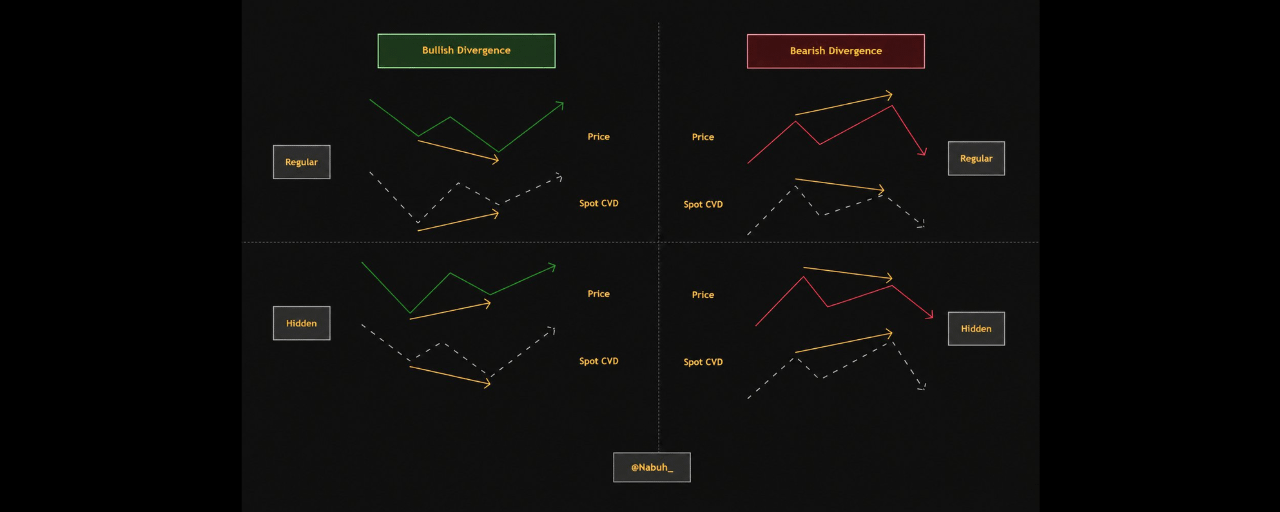
This is where CVD becomes a real edge. Divergences between price and CVD are some of the highest quality signals in orderflow analysis.
Bullish Regular: Price makes a lower low but CVD makes a higher low. Buyers are increasing their aggression despite the price dropping. Reversal signal.
Bullish Hidden: Price makes a higher low but CVD makes a lower low. Limit buyers are absorbing the sell pressure. Continuation signal.
Bearish Regular: Price makes a higher high but CVD makes a lower high. Distribution is happening at the top. Reversal signal.
Bearish Hidden: Price makes a lower high but CVD makes a higher high. Sellers are absorbing buy pressure. Continuation signal.
Adding Futures CVD + Open Interest
When you combine Futures CVD with Open Interest, the picture gets even clearer.
Futures CVD ↑ + OI ↑ = New longs entering the market. Strong directional move with conviction.
Futures CVD ↑ + OI ↓ = Shorts being liquidated. Short squeeze. Less reliable, don't chase it.
This distinction matters enormously. A move driven by new longs is fundamentally different from a move driven by short liquidations. One has follow-through potential, the other often fades.
Real World Application
Here is how to apply this in practice. Before entering any trade, ask three questions:
Is spot CVD confirming the price move or diverging from it?
Is OI expanding or contracting on this move?
Is the move spot-driven or futures-driven?
If spot CVD is leading, OI is expanding, and the move is spot-driven — that is a high conviction setup. If spot CVD is diverging, OI is dropping, and futures are leading — treat it with caution.
The Bottom Line
CVD won't give you every answer. But combined with structure and key levels, it tells you whether a move has real participation behind it — or if it's just noise. That's the edge most retail traders don't have.
Save this. Share it with someone who needs it.