We are currently observing a highly defined technical structure on the #Bitcoin daily chart that warrants close attention. $BTC has just printed a textbook Bear Flag formation. 📉🚩
🧠 Understanding the Structure
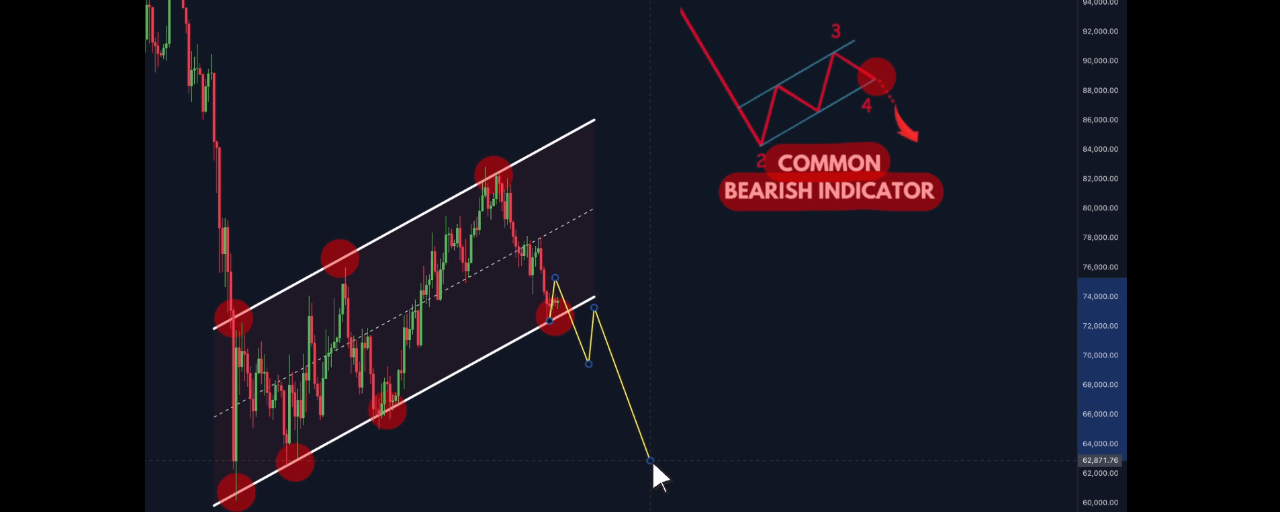
For those refining their technical analysis (#TA), this pattern is a classic continuation signal that typically unfolds in three distinct phases:
📉 The Flagpole: A sharp, impulsive downward drop in price.
📈 The Flag: A temporary period of upward consolidation tightly bound within a parallel channel.
💥 The Breakdown: A structural failure of the channel's support, leading to a continuation of the initial downtrend.
Within traditional and Crypto markets alike, the bear flag remains one of the most statistically reliable continuation patterns when trading higher timeframes. ⚖️
⏪ Historical Precedent
Context and market memory are critical. 🕰️ The last time $BTC established this exact structural setup on the daily chart was just prior to the February flush, which drove the market from the $90K level down to $60K. 🩸💸
🛡️ Strategic Takeaway
While technical patterns deal in probabilities rather than certainties, capital preservation should always remain the priority when high-probability bearish signals emerge. 💼🔒
#BitcoinAnalysis #BearFlag #TechnicalAnalysis #MarketUpdate
