
Spot Bitcoin ETFs bled $483.76M on June 1 with BlackRock IBIT leading at $440.29M in a single day
BTC broke below the ascending channel lower trendline for the second time with all four EMAs and SAR overhead
Benjamin Cowen calls for a $70K tag followed by a bounce then a revisit of February 2026 lows
Bitcoin trades at $70,261 on June 2, breaking below the ascending channel that recovered price from the February lows, as spot ETF outflows accelerate into the new month and analysts increasingly point toward the February 2026 lows as the June destination.
BTC June 2026 Price Outlook: Second Channel Break and February Lows Back in Play
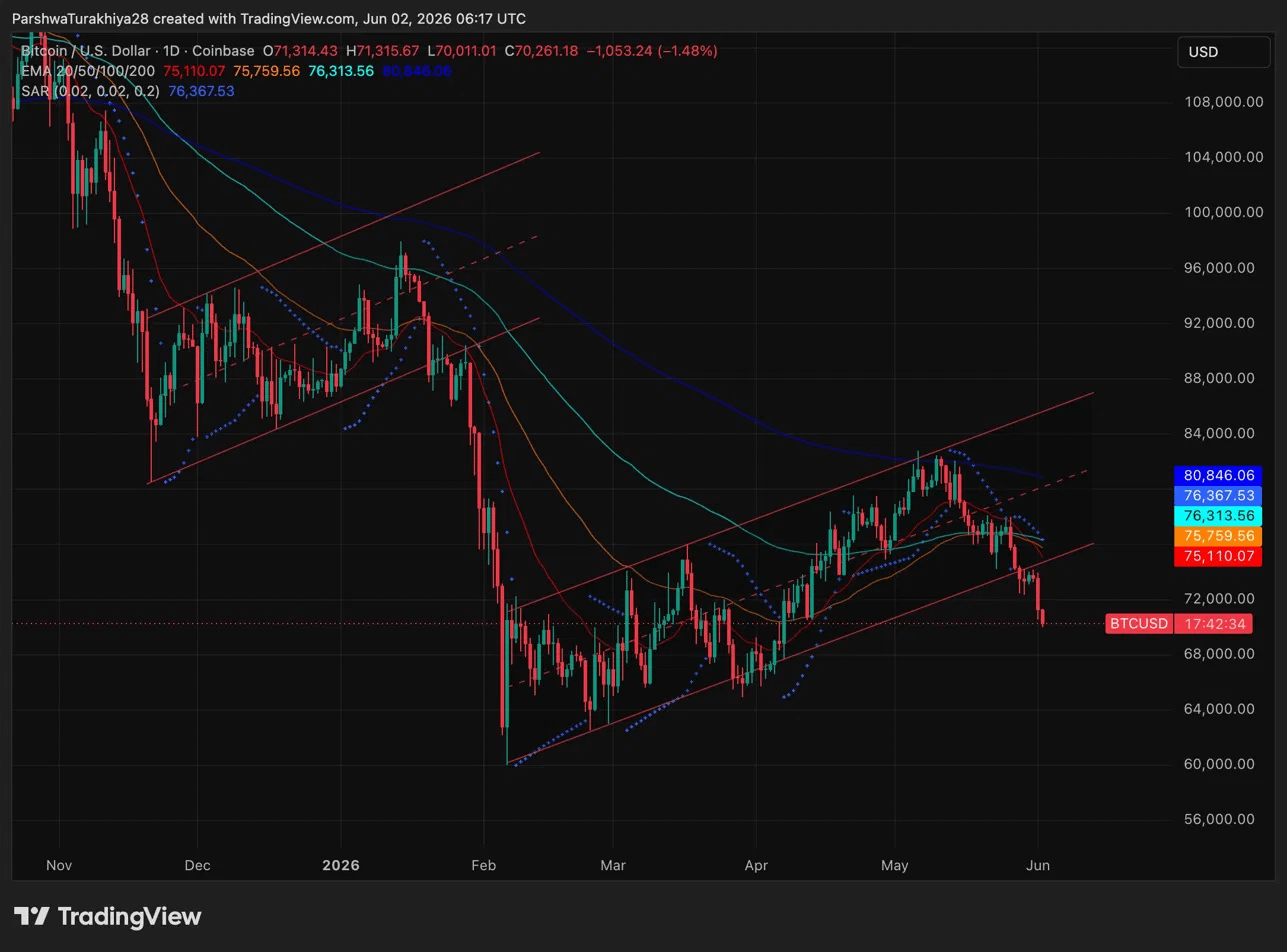
BTC built an ascending channel from the February lows near $60,000 through the May high near $83,000, then broke below the lower trendline. Price recovered briefly back inside the channel in late May before breaking down again heading into June. Two breaks of the same channel without recovery is not a retest, it is a failed structure.
All four EMAs sit above current price. The 20 EMA at $75,110, the 50 EMA at $75,759, the 100 EMA at $76,313, and the 200 EMA at $80,846 are all clustered in the same zone, with the SAR at $76,367 adding another ceiling in the same area. Reclaiming $75,110 on a weekly close is the minimum requirement before any bullish June case has merit. The horizontal support near $71,000 is thinning after repeated tests. Below that, the February lows near $60,000 are the next meaningful demand area with nothing clean in between.
BTC Key levels for June:
Resistance: $75,110 (20 EMA), $76,313 (100 EMA), $76,367 (SAR)
Support: $71,000 (horizontal), $65,000 (prior base), $60,000 (February lows)
Cowen and Schiff Agree on Direction for Different Reasons
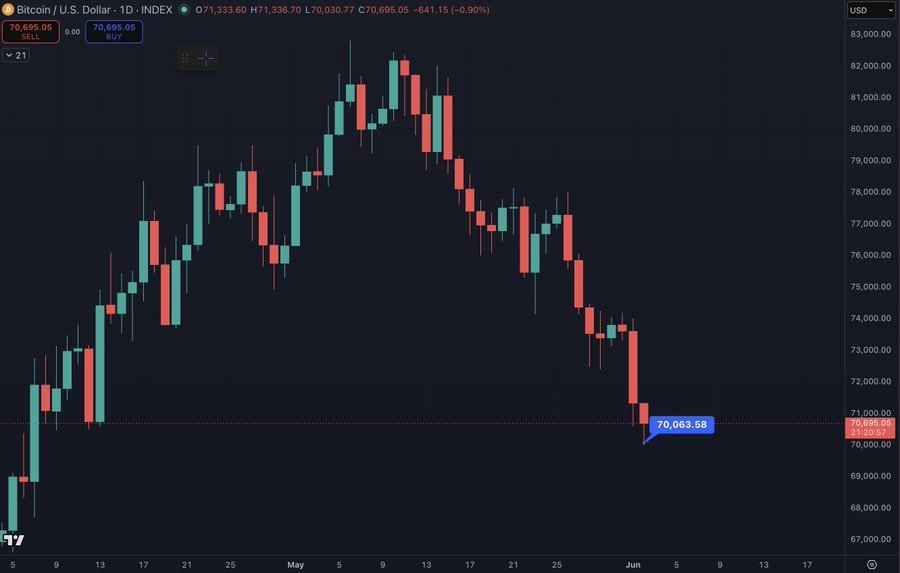
Benjamin Cowen posted that BTC has now tagged $70,000 as he expected, with his base case calling for a small bounce of a few days to a week followed by a return to the February 2026 lows. He framed the call openly, stating if he is wrong about revisiting those lows he will publicly say so. His read sits inside the midterm year pattern he has flagged all year, where June historically marks the weak point before a summer bounce and Q4 resolution.
ETF Outflows Are Now a Trend Not a Single Event
Spot Bitcoin ETFs bled $483.76M on June 1 with BlackRock IBIT alone accounting for $440.29M. Fidelity FBTC added $37.29M and Ark and 21Shares ARKB contributed another $12.32M. Total net assets now sit at $91.16B, down from a peak above $109B in April.
May closed with more than $2.43B in cumulative net outflows from spot Bitcoin ETFs. The selling accelerated toward month-end with approximately $1.42B pulled over the final week alone, the third-largest weekly outflow on record. Outflows have printed red on eleven of the last thirteen trading days and the pace is getting worse, not stabilizing.


BTC Price Prediction for June 2026
Downside: Losing $71,000 on a weekly close accelerates the path toward the February lows near $60,000, which is Cowen’s stated destination after any near-term bounce resolves.
Upside: A bounce off $70,000 that reclaims $75,110 and holds the 20 EMA on a weekly close delays the February low retest and opens $78,000 to $80,000, but that requires ETF outflows to reverse after nearly two weeks of consecutive red.
#XRPDropsBelow$1.30OnHeavyVolume