Many traders lose money because they rush. I was the same. Then I learned to read candlestick charts properly and everything changed. Today I share my real live trading strategy with you — no secrets, no hype, just real market reading.
📊 Understanding Candlestick Charts
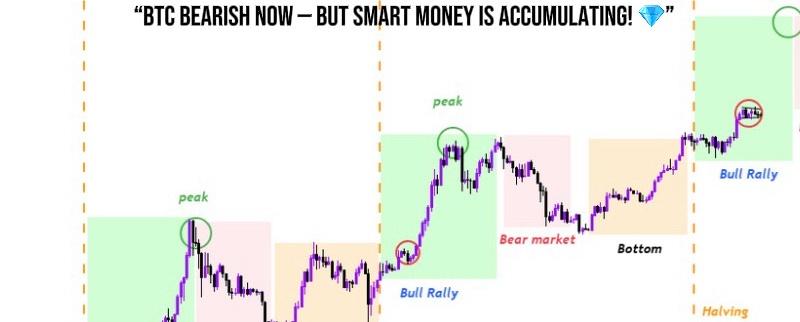
Every candle tells a story:
• 🟢 Green candle = price went UP (buyers winning)
• 🔴 Red candle = price went DOWN (sellers winning)
• Long wick on top = price was rejected higher
• Long wick on bottom = price was rejected lower
• Small body = market is undecided
Never trade a single candle. Always look at the bigger picture.
⏳ My #1 Rule — Never Be First
The biggest mistake beginners make is entering too early. I always wait for:
✅ 2-3 candle confirmation
✅ Volume to increase
✅ Clear trend direction
✅ Support or resistance level
Patience is your most powerful trading tool.
💡 My Live Trading Strategy
Step 1 — Find the Trend
• Look at 4H or 1D chart first
• Is price making higher highs? = Uptrend 📈
• Is price making lower lows? = Downtrend 📉
Step 2 — Wait for Pullback
• Never chase price
• Wait for price to pull back to support
• Let the candles confirm the bounce
Step 3 — Enter the Trade
• Enter only after confirmation candle closes
• Set your Stop Loss below support
• Set your Take Profit at next resistance
Step 4 — Manage the Trade
• Never move Stop Loss against you
• Take partial profit at 50% target
• Let the rest run
🔒 Risk Management Always
• Never risk more than 1-2% per trade
• USDT TRC20 is my safe haven.