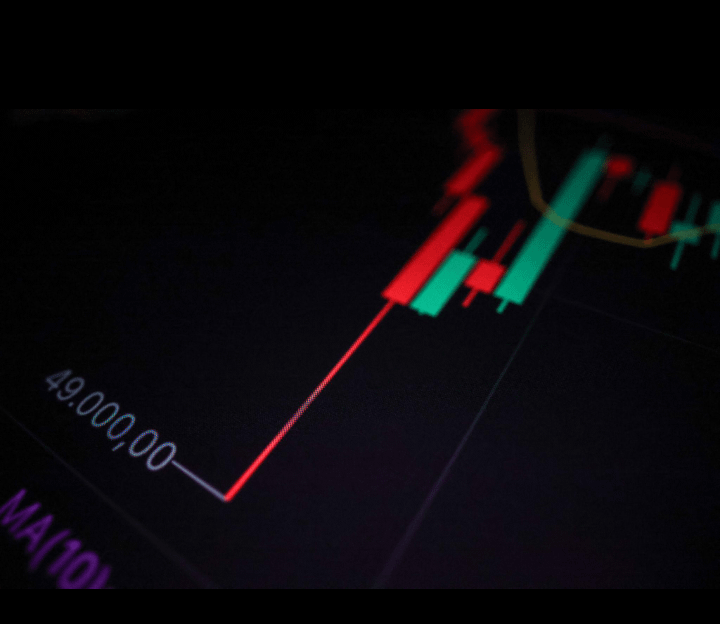
📊 Crypto Trading Signals (How they work)
A trading signal is basically a trigger idea based on technical indicators + market structure.
🔑 1. Trend Signal
📈 Uptrend → higher highs + higher lows
📉 Downtrend → lower highs + lower lows
👉 Simple rule:
Buy bias in uptrend
Sell/short bias in downtrend
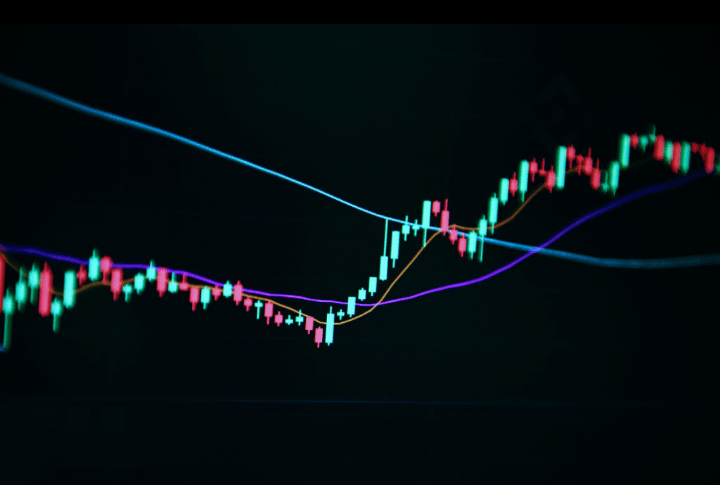
📊 2. Moving Average Signal (MA)
Common ones:
50 MA
200 MA
Signal:
🟢 Price crosses ABOVE MA → bullish signal
🔴 Price crosses BELOW MA → bearish signal
📉 3. RSI Signal (Strength indicator)
�
RSI > 70 → overbought (possible drop)
RSI < 30 → oversold (possible bounce)
📊 4. Support & Resistance Signals
🟢 Buy zone = strong support level
🔴 Sell zone = strong resistance level
Breakout signal:
Price breaks resistance → bullish continuation
Price breaks support → bearish continuation
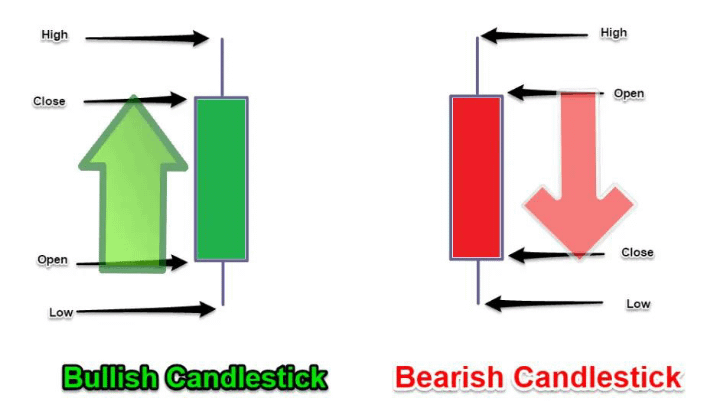
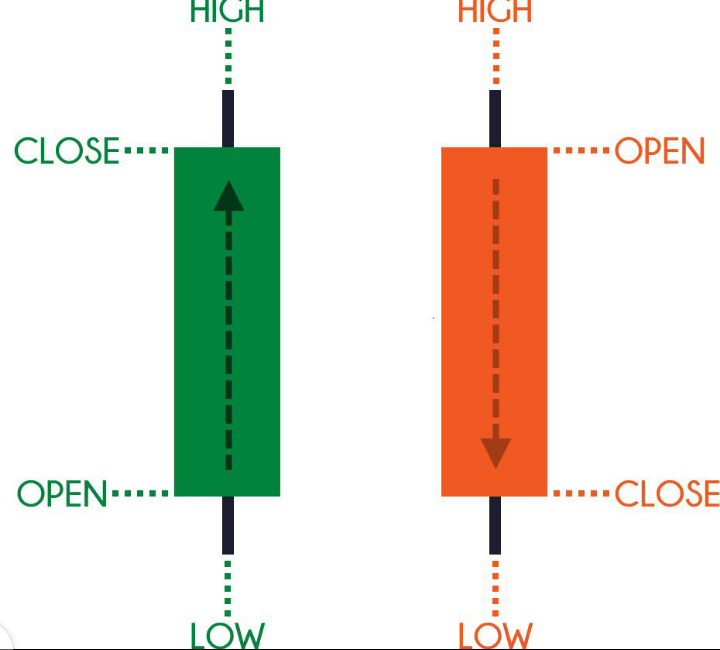
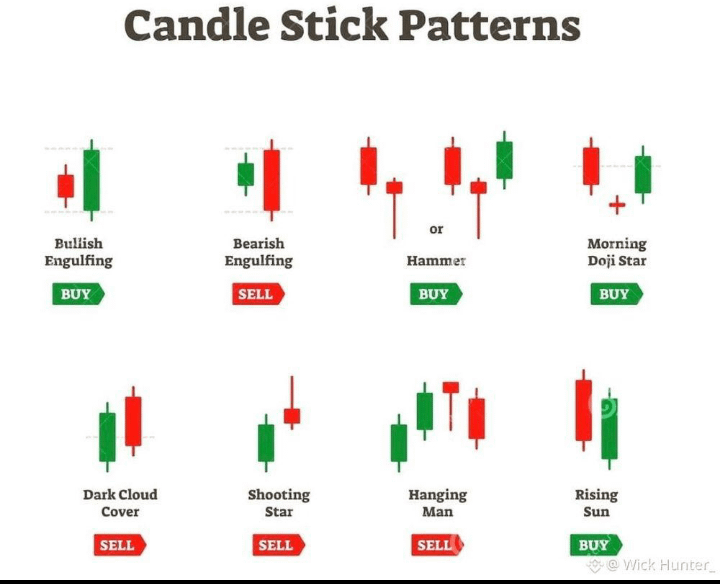
🕯️ 5. Candle Signal (Very Important)
🟢 Strong green candle → buyers in control
🔴 Strong red candle → sellers in control
Doji candle → market uncertainty
Long wick → rejection area
⚡ Example Simple Signal (Educational)
BTC example idea:
Price above 50 MA ✔️
RSI = 45 (neutral) ✔️
Breaks resistance ✔️
👉 This would be considered a bullish continuation setup
⚠️ Important Warning
Crypto signals are:
Not 100% accurate
Highly affected by news & manipulation
Risky in low-volume coins
👍 If you want next:
I can generate for you:
📈 �Live BTC / ETH trading signal setup
🔥 �Daily crypto signals list
🧠 �Simple “profit strategy for beginners”
📊 �Candle chart reading guide (easy)
Just tell me 👍