
APR is one of the most important numbers in DeFi yield farming. It helps users compare liquidity pools, farming campaigns and passive income opportunities. But APR can also be misleading.
A pool may show 200%, 500% or even higher APR. At first glance, that looks like a strong opportunity. But the APR displayed on a DeFi interface is often not the same as the APR a yield farmer will actually earn.
This is especially true for concentrated liquidity pools. In these pools, LPs choose a price range for their liquidity. If the market price stays inside that range, the position earns trading fees. If the price moves outside the range, the position may stop earning fees.
That means a high advertised APR can look attractive while the real return depends on your selected range, active time, position size, reward structure and market movement.
What Is Advertised APR in DeFi?
Advertised APR is the headline yield number shown on a pool page, farming page or liquidity dashboard. It is usually calculated by annualizing recent fees, rewards or both.
A simple formula looks like this:
APR = (Earnings ÷ Liquidity) × Annualization factor
The formula looks simple, but each platform may calculate it differently.
Some platforms use total pool TVL. Some use only active liquidity. Some annualize fees from a short time window. Some concentrated-liquidity platforms calculate APR based on the active price tick and nearby ticks. That can make APR look extremely high when liquidity is placed in a super-tight range around the current market price.
This is not always wrong, but it can be incomplete. A tight range may earn more while active, but it can go out of range quickly. Once out of range, the position may stop earning trading fees.
So advertised APR should be treated as a signal, not a promise.
Why Concentrated Liquidity Makes APR More Complicated
Concentrated liquidity gives LPs more control over where their capital is used. Instead of spreading liquidity across all possible prices, LPs can place capital inside a selected price range. This improves capital efficiency, but it also makes APR harder to understand.
Two LPs can join the same pool at the same time and earn very different results. One LP may choose a wide range. The position may stay active longer, but earn lower fees per dollar of liquidity. Another LP may choose a narrow range. The position may earn higher fees while active, but it requires more monitoring and can go inactive faster.
This is why pool-level APR is not enough. A pool APR can show that a pool is active, but it cannot tell you whether your own position will perform well. For yield farmers, the real APR depends on the actual position.
How Short-Term APR Can Mislead Yield Farmers
Advertised APR can be useful for discovery, but it can create unrealistic expectations when taken at face value.
1. APR can be based on a very tight range
Some interfaces show APR based on liquidity near the current price. This can make the number look much higher than what a normal LP may earn.
A narrow range can be profitable when price stays inside it. But it also needs more active management. If price moves out of range, the position may stop earning fees.
For passive LPs, a very high tight-range APR can be difficult to capture.
2. APR can be annualized from short-term activity
Many APR numbers are based on recent activity. If a pool had a large volume spike in the last 24 hours, APR can look very high.
But a one-day spike does not mean the same activity will continue for a full year.
Short-term APR is useful for spotting momentum, but yield farmers should compare different timeframes before entering.
3. Pool APR is not the position APR
A pool can show strong APR while your own position performs poorly.
This can happen when your range is too wide, too narrow or out of range. It can also happen when most fees are captured by other positions placed closer to the active price.
That is why position-level APR matters more than headline APR.
Type of APR on KyberSwap: A More Transparent Way to Measure Yield
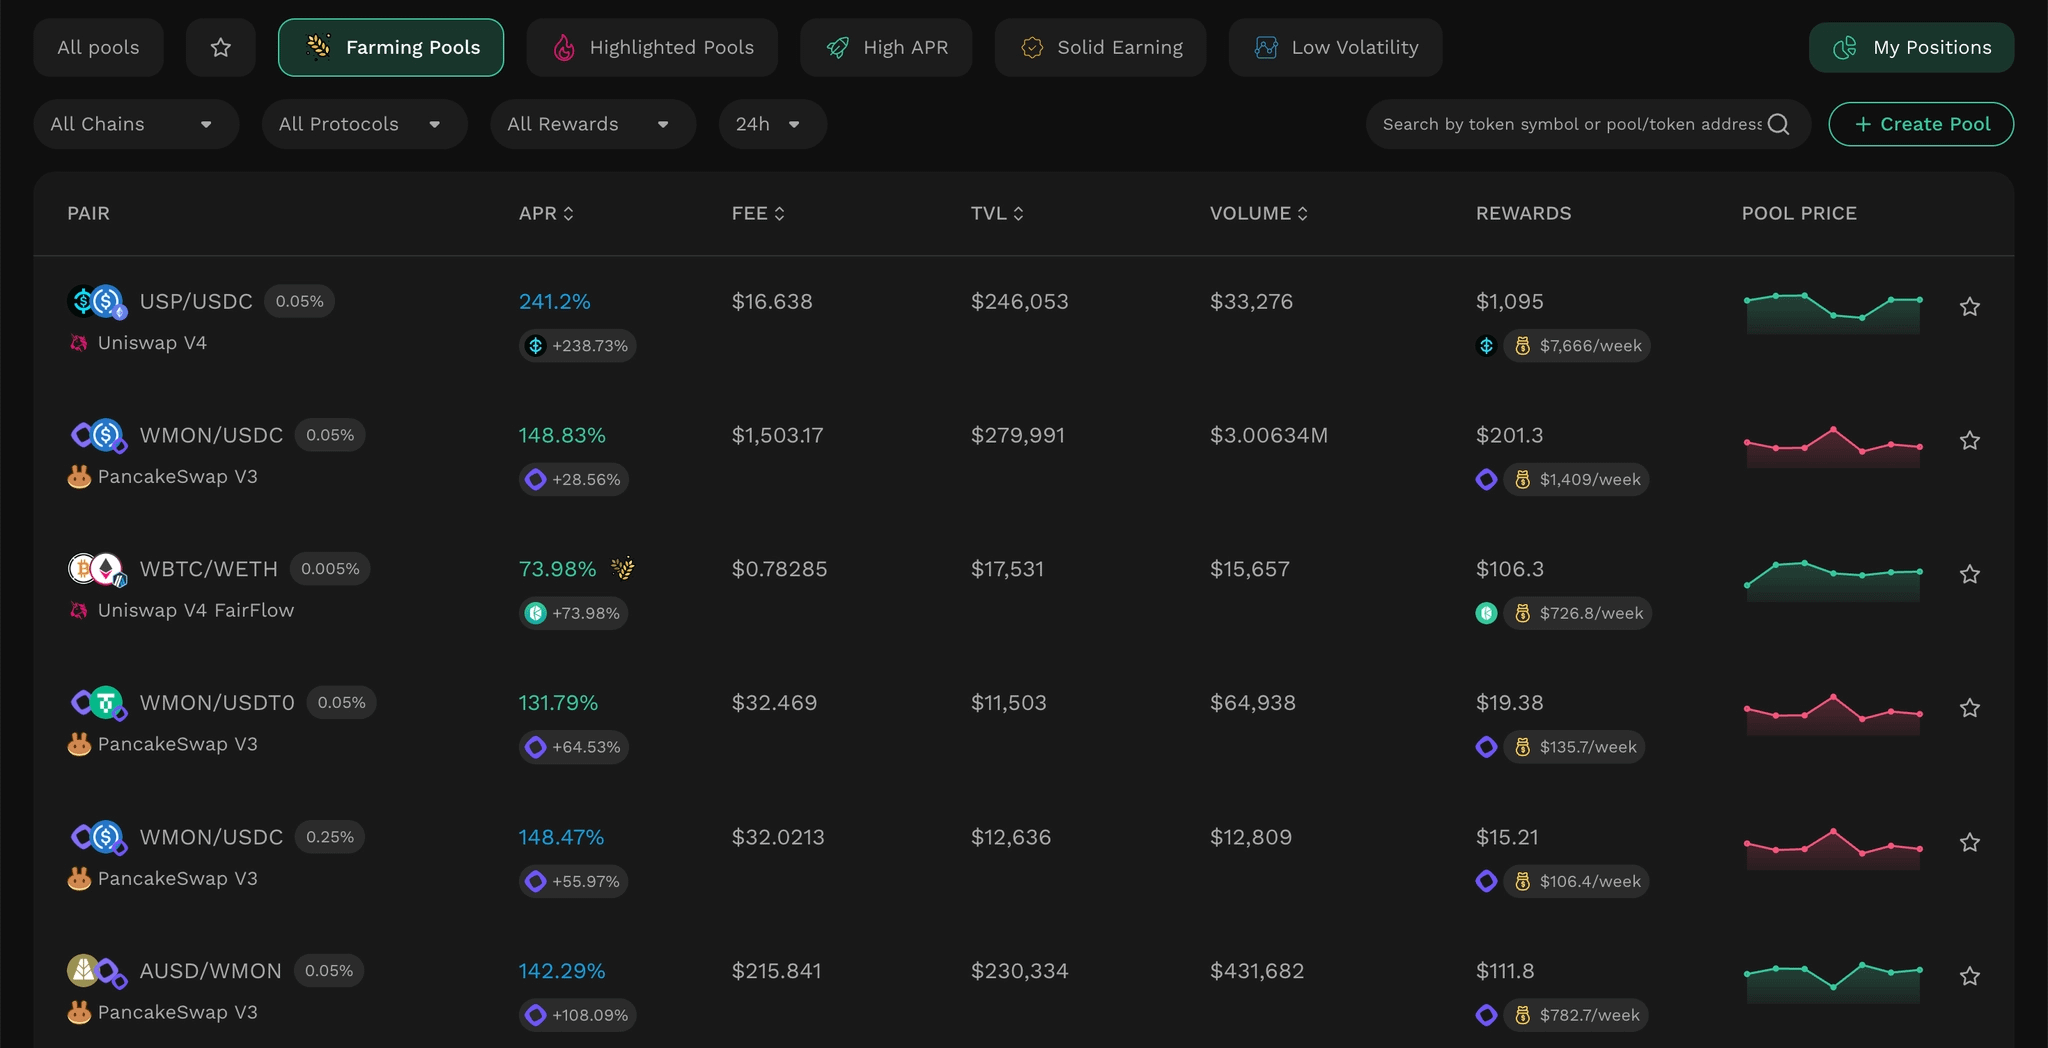
KyberEarn helps LPs understand APR with multiple metrics instead of one headline number. This gives users more context when comparing pools and managing positions.
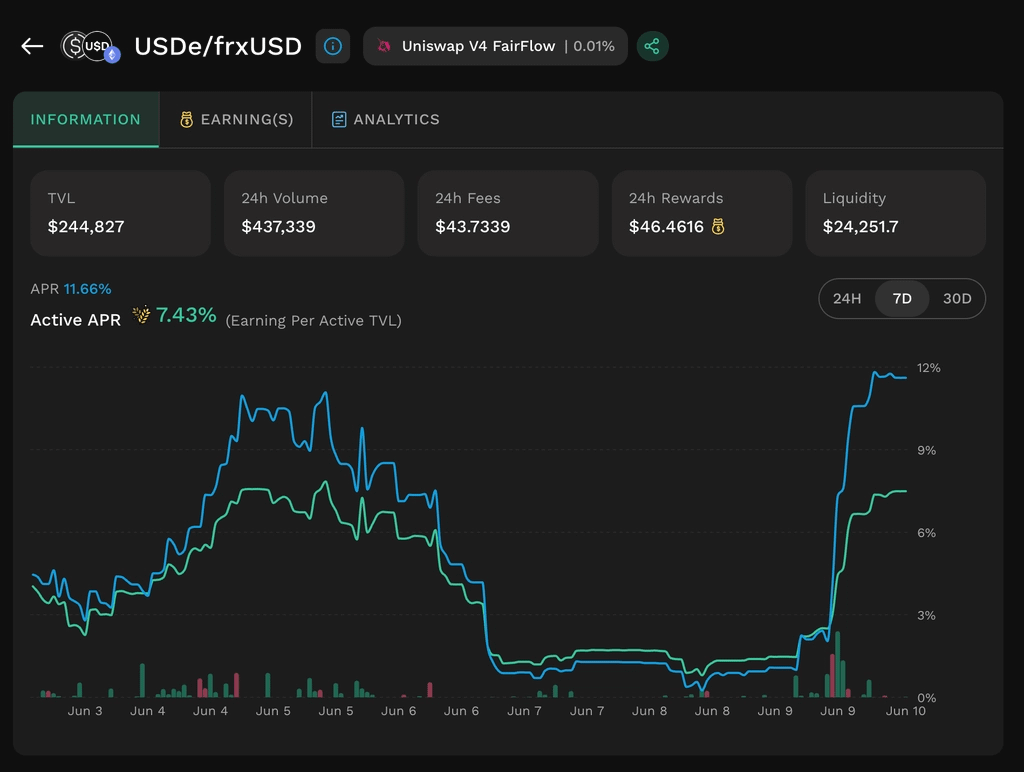
Est. Pool APR
Annualized return based on total fees earned by the pool over the selected time window: 24h, 7d or 30d. It is measured relative to total pool TVV and serves as the standard baseline metric for comparing pool performance. Benefit for LPs: helps LPs quickly compare pools’ earnings and identify where trading activity may be strong.
Est. Active APR
Annualized return based on earnings relative to active TVL only, meaning liquidity currently within the price range. It excludes out-of-range capital from the denominator. Benefit for LPs: shows how efficiently active liquidity is earning and gives a clearer view of in-range yield potential.
Max APR
The highest APR observed across all positions in the pool. It represents the return ceiling for a strategically placed position. Benefit for LPs: helps LPs understand the best possible earning potential.
Est. Position APR
Estimated annualized return for a new position. It is based on projected fee earnings and applicable rewards under current conditions. Provided for reference only and does not guarantee future returns. Benefit for LPs: helps LPs estimate potential yield before adding liquidity.
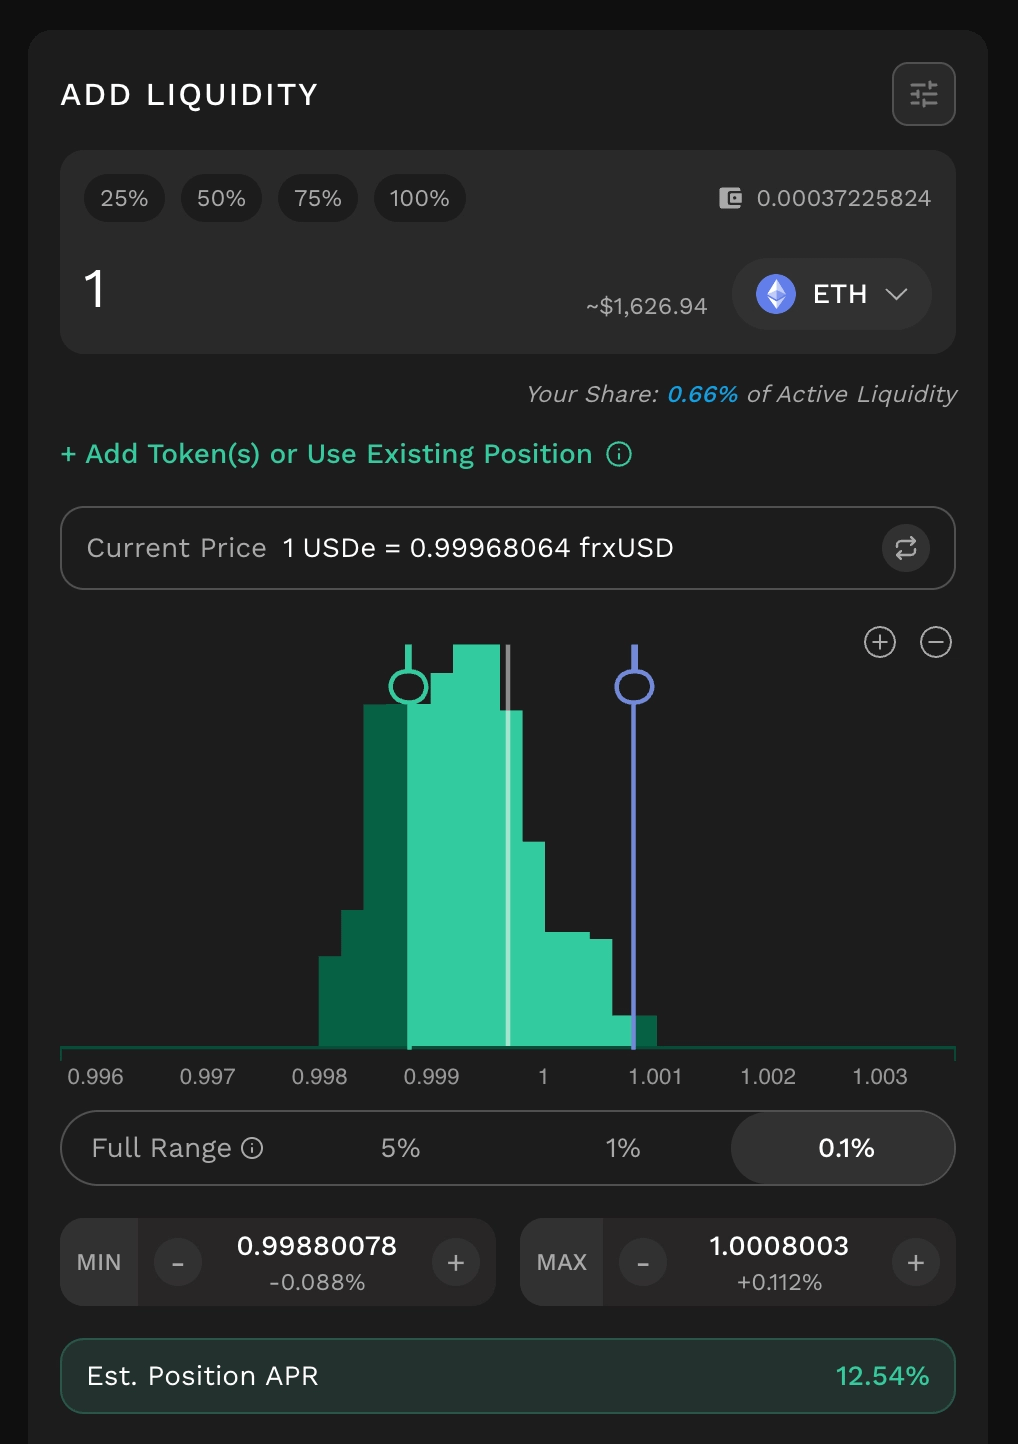
Est. Position APR based on selected range
The Position APR Estimation feature - currently implemented in FairFlow farming pools - displays an Estimated Position APR when users select their desired price range during the liquidity provision process. Benefit for LPs: helps LPs estimate potential yield at a selected range.
Est. My Position APR
Annualized return of an existing position, calculated from fees earned relative to its current value over the selected time window. It reflects realized performance. Benefit for LPs: helps LPs track how their own position is performing.
What Yield Farmers Should Actually Measure
The best yield farmers look beyond the biggest APR number.
First, measure active time. If your liquidity is out of range, it may not earn trading fees. A lower APR position that stays active longer can outperform a higher APR position that constantly goes inactive.
Second, separate fee APR and reward APR. Organic fee income shows real market demand. Rewards can improve returns, but they may be temporary.
Third, check position-level APR. Your selected range matters more than the pool average. A pool can be attractive while your own position is inefficient.
Fourth, account for impermanent loss. APR does not show whether your LP position is outperforming a simple hold strategy.
Fifth, consider management effort. A tight range can generate high APR while active, but it requires more attention. A wider range may earn less per dollar, but it can be easier to manage.
Real APR is not just the number shown on the interface. It is the return your capital can realistically capture.
Why KyberSwap Helps LPs Make Better Yield Decisions
KyberSwap is a Smart DeFi Hub that helps users discover, analyze, execute, track and optimize in one place.
For traders, KyberSwap supports best-rate and execution swapping. For LPs, KyberEarn brings liquidity opportunities, APR metrics, position insights and management tools into one workflow.
KyberEarn helps users compare pools, understand APR sources and monitor position performance. KyberZap helps users enter liquidity positions more easily by zapping from supported tokens into liquidity pools. Smart Exit helps LPs exit positions more efficiently when they want to manage risk or rebalance.
This matters because yield farming is not only about finding a high APR pool. It is about understanding whether the opportunity fits your capital, risk tolerance and management style.