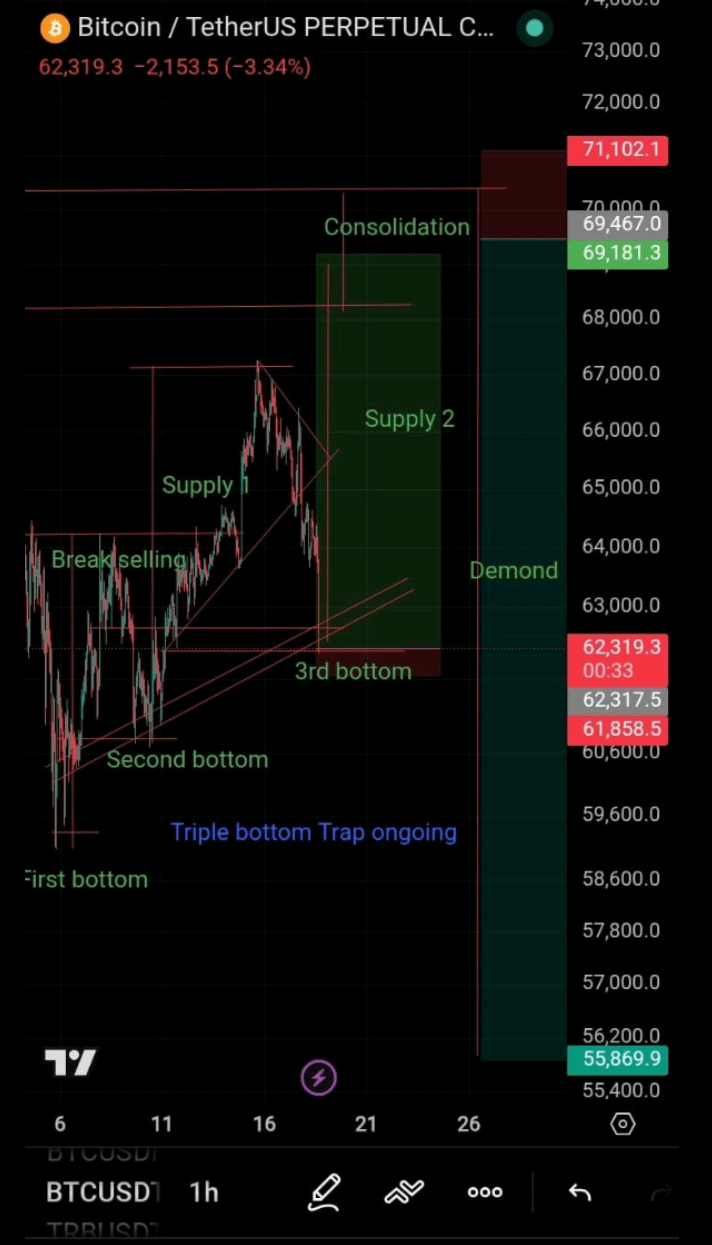
$BTC Bitcoin is currently trading near a critical support zone, and the chart suggests that a potential triple bottom pattern may be forming. If this setup holds, it could signal the start of a strong bullish move over the coming days.
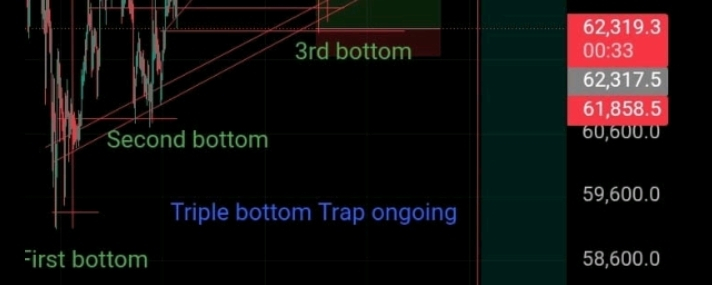
The first and second bottoms have already been established, while the market is now testing the third bottom. This area is crucial because buyers have repeatedly stepped in to defend it. If demand remains strong, Bitcoin could reverse from this level and begin climbing higher.
The chart also highlights two major supply zones. Before reaching higher prices, Bitcoin will need to break through these resistance levels. Once these zones are cleared, a period of consolidation around $69,000 could follow, creating a stronger base for the next move.
If bullish momentum continues, Bitcoin could target the $BTC 71,000–$BTC 72,000 range. However, traders should remember that losing the current support around $62,000 could invalidate the setup and lead to further downside.
As always, risk management is essential. No chart pattern guarantees success, but the current structure is one that many traders will be watching closely over the new few sessions.