
📈 ETH/USD (4H) Professional Technical Analysis
🪙 Asset: Ethereum (ETH/USD)
Timeframe: 4 Hours
Current Price: ~$1,705
Market Structure: Bullish Recovery Within Ascending Channel 🔼
🎯 Market Overview
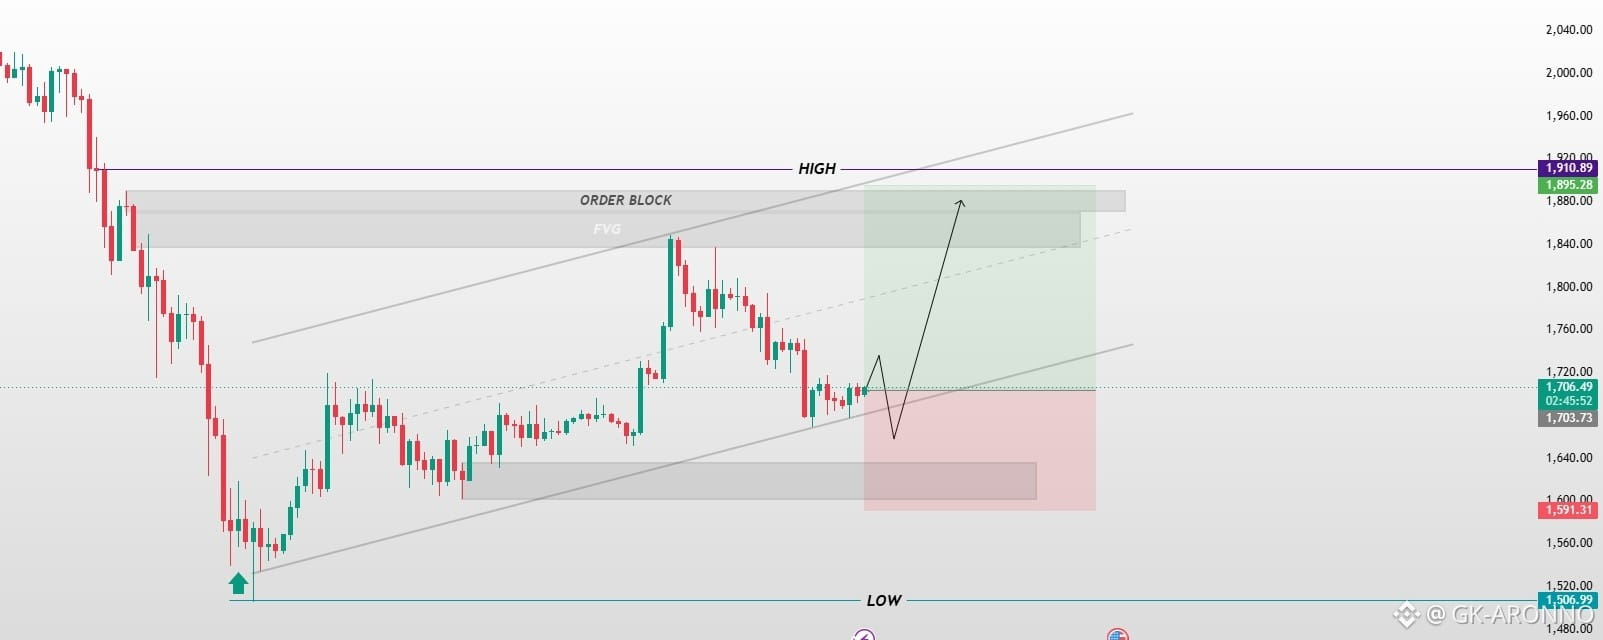
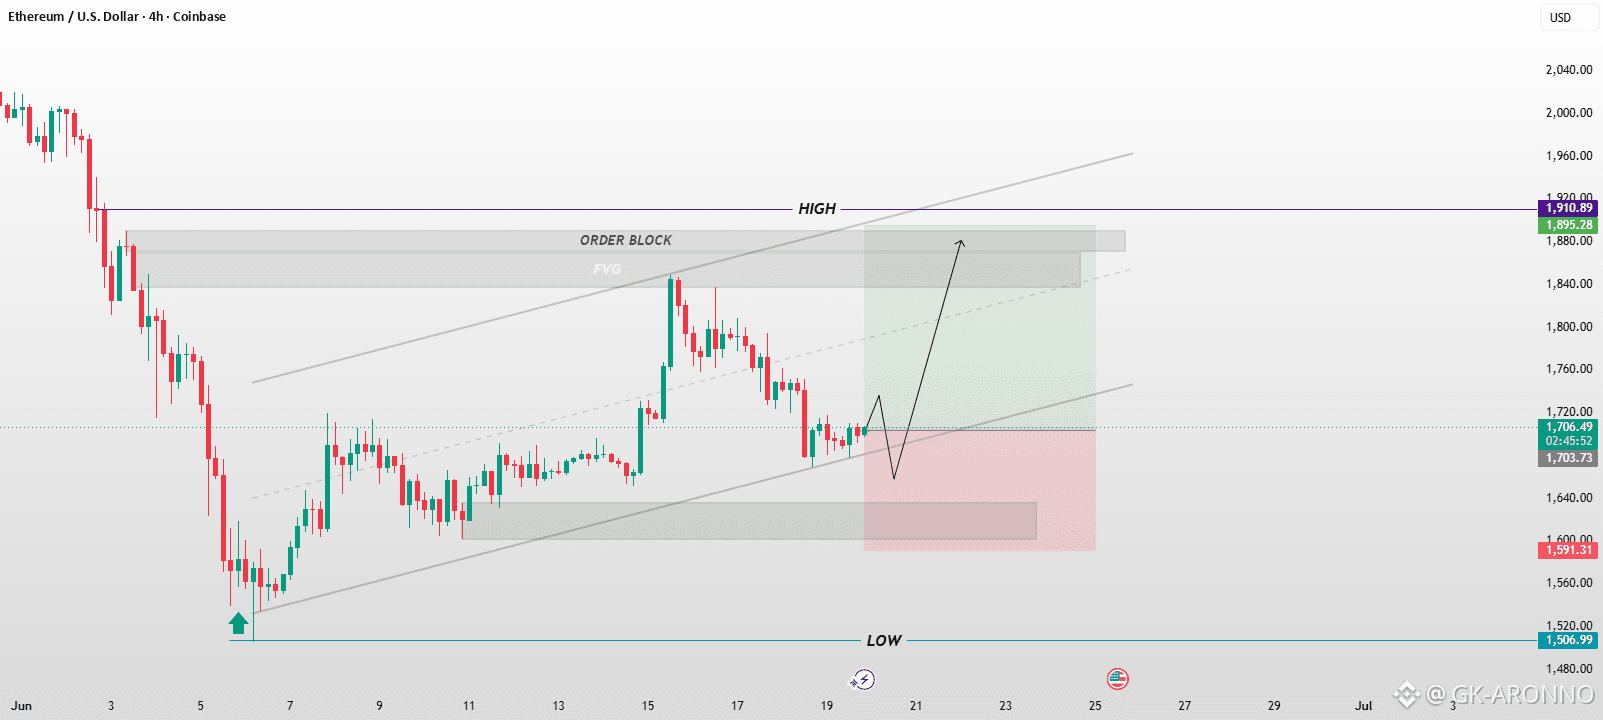
ETH has formed a strong rebound after establishing a major swing low around $1,506. Price is currently trading inside a well-defined ascending channel, suggesting buyers remain in control despite the recent pullback.
The chart highlights a potential buy-the-dip setup with a favorable risk-to-reward profile.
🏗️ Key Technical Structure
🟢 Bullish Ascending Channel
Higher lows are being respected.
Price remains above the channel support.
Trend structure favors continuation toward higher resistance levels.
📦 Demand Zone (Support)
$1,590 – $1,620
This gray zone represents:
Previous accumulation area.
Institutional demand region.
Potential liquidity grab before continuation higher.
✅ A retest into this zone could attract fresh buyers.
🚀 Upside Targets
🎯 Target 1: Order Block
$1,860 – $1,890
Major supply zone.
Previous rejection area.
First profit-taking level.
🎯 Target 2: Previous High
$1,910
Marked as "HIGH" on chart.
Key liquidity target.
Potential breakout trigger.
🎯 Extended Target
$1,950 – $1,980
If ETH breaks above $1,910 with volume, continuation toward the upper channel boundary becomes likely.
⚠️ Risk Management
🛑 Stop Loss Zone
Below $1,590
Reason:
Below demand zone.
Below channel support.
Would invalidate the current bullish setup.
🧠 Smart Money Concepts (SMC)
📦 Order Block
Located around:
$1,860 – $1,890
This area likely contains:
Institutional sell orders.
Unfilled supply.
Potential short-term resistance.
⚡ Fair Value Gap (FVG)
The highlighted FVG below the order block suggests:
Price may seek inefficiencies.
Magnet zone for future price action.
Confluence with resistance.
📊 Trade Idea
🟢 Bullish Scenario (Higher Probability)
Pullback toward channel support.
Hold above $1,650–$1,620.
Bounce with bullish confirmation.
Move toward:
🎯 $1,860
🎯 $1,910
🎯 $1,950+
🔴 Bearish Scenario
If price closes decisively below $1,590:
Channel structure fails.
Demand zone breaks.
Retest of $1,506 low becomes possible.
📈 Risk-to-Reward Assessment
Entry Zone Stop Loss Target R:R
$1,680-$1,720 $1,590 $1,860-$1,910 ~2.5:1 to 3:1 ✅
🔥 Analyst Verdict
Bias: 🟢 Bullish
Trend: 🔼 Uptrend Channel
Setup Quality: ⭐⭐⭐⭐☆ (4/5)
Key Level to Watch: $1,590 Support
Primary Target: $1,910 Liquidity High
💡 Conclusion: The chart suggests ETH is undergoing a healthy pullback within a bullish channel. As long as price remains above the $1,590 demand zone, the probability favors a continuation toward the $1,860–$1,910 resistance area. A break above $1,910 could trigger the next bullish expansion phase. 🚀📈
