Bitcoin ka monthly chart wohi repeat kar raha hai
jo har single cycle mein karta aaya hai.
 ❌ No exceptions
❌ No misses
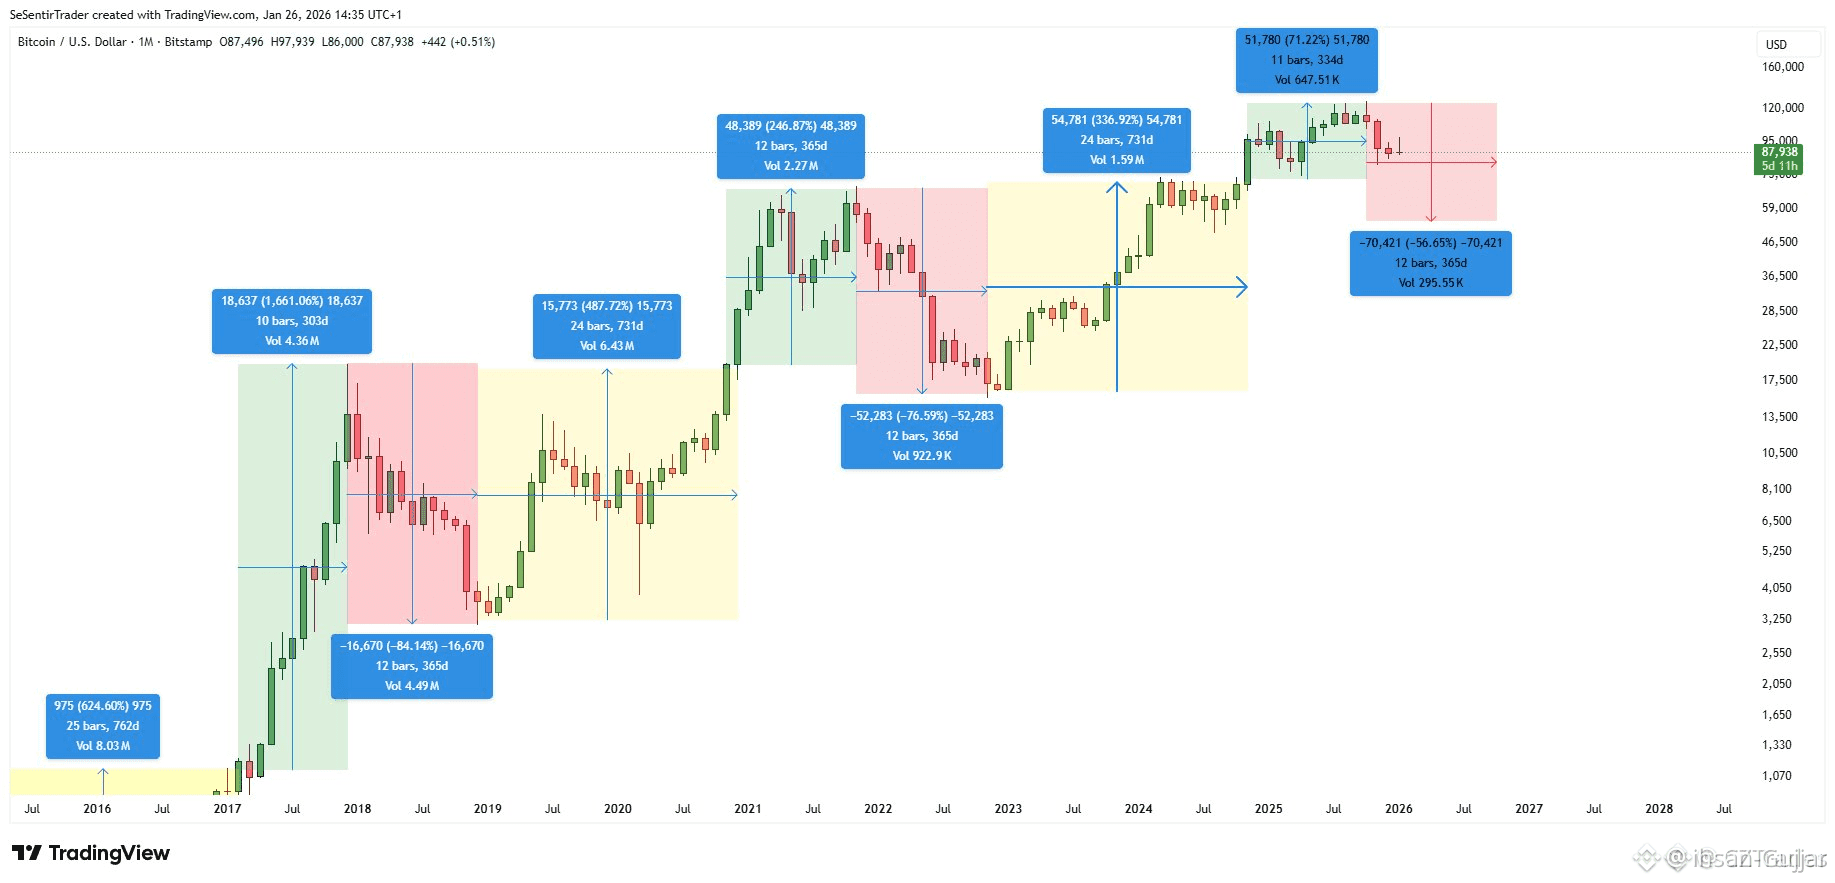
📊 Since 2013, $BTC always follows this exact pattern:
• 2 years of steady accumulation
• 1 year of explosive bull run 🚀
• 1 year of brutal bear market 🩸
🔥 Bull run peaked in October 2025.
That phase is officially over.
📉 We are now in the bear market,
and history says this phase can last until October 2026.
🧠 If the cycle repeats:
• BTC may first chop around $80,000
• Then slowly slide toward ~$50,000 by Oct 2026
📌 This is the only indicator that has never failed me.
🔖 Save this.
I’ll revisit it in October 2026.