📰 ETH/USDT Analysis: Breakout or Fakeout? 📊
Market Overview
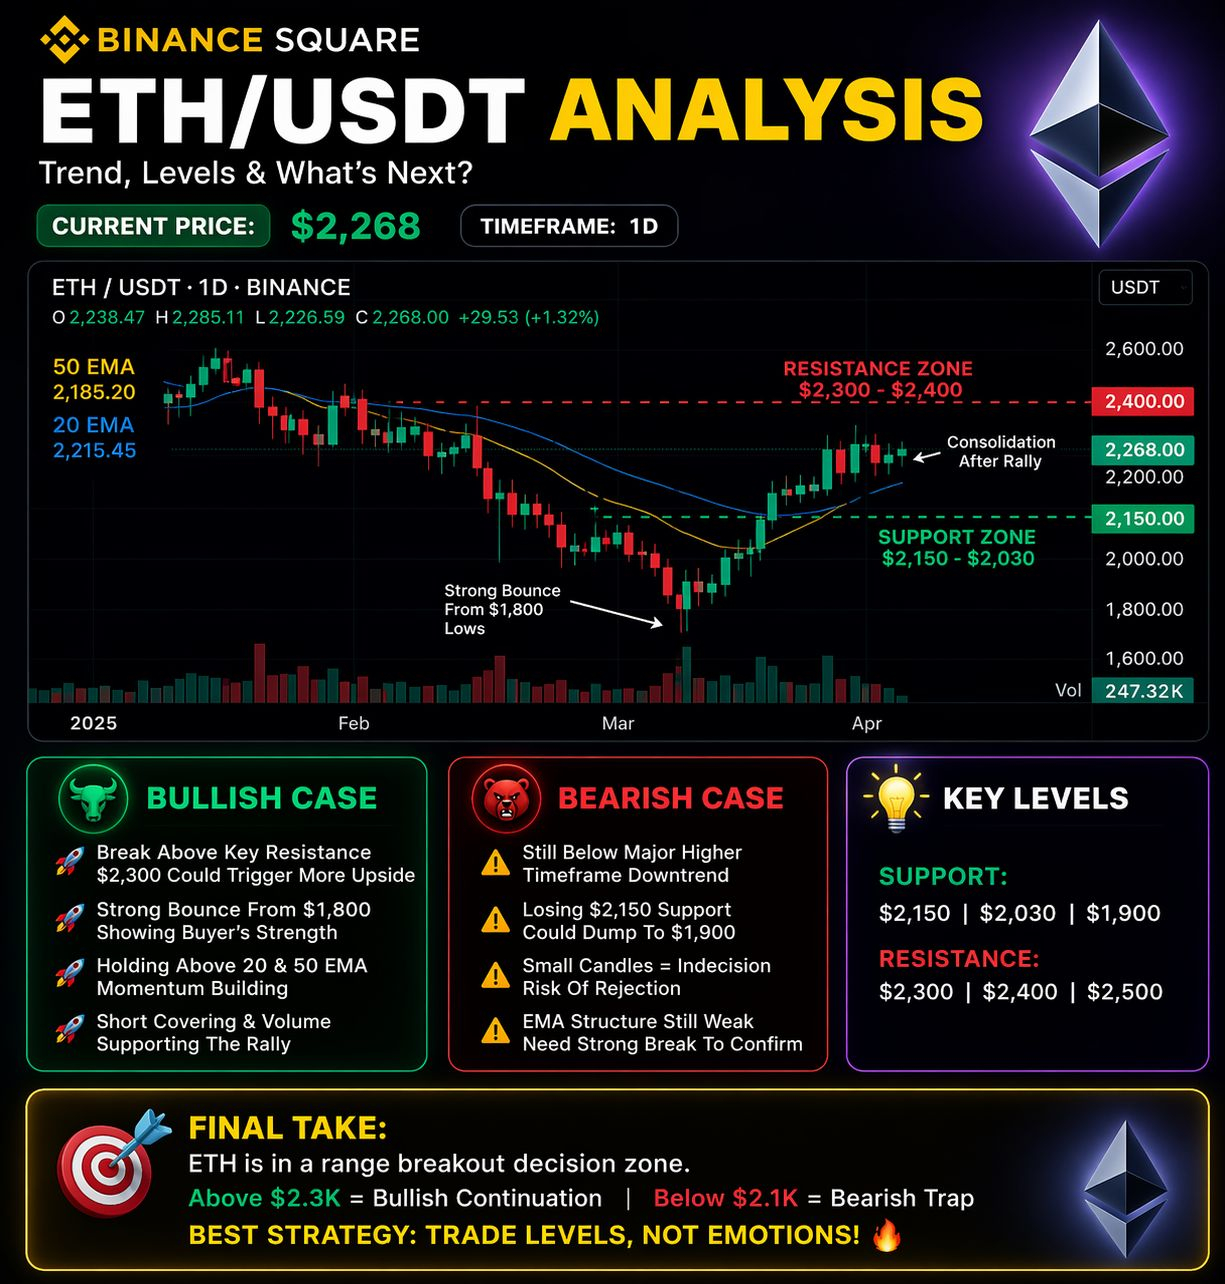
Ethereum (ETH) is currently trading in a key decision zone, showing signs of recovery after a strong bounce from recent lows. The market is now at a point where the next move could define short-term trend direction.
📊 Technical Structure (Candles Insight)
Strong bullish bounce from ~$1,800 zone
Followed by small consolidation candles → indecision
Price holding above short-term EMAs = buyers still active
👉 This usually leads to a volatile breakout move
🚀 Bullish Scenario
Break above $2,300–$2,400 resistance → continuation rally
Higher lows forming → trend strengthening
Volume support increasing
🎯 Target zones: $2,500 → $2,700
⚠️ Bearish Scenario
Rejection from resistance → possible fakeout
Loss of $2,150 support → sharp drop risk
Weak higher timeframe structure still in play
🎯 Downside targets: $2,000 → $1,900
🎯 Key Levels to Watch
Support: $2,150 | $2,030 | $1,900
Resistance: $2,300 | $2,400 | $2,500
🧠 Final Take
ETH is in a range breakout zone
👉 Above $2.3K = bullish continuation
👉 Below $2.1K = bearish pressure
Best strategy:
Trade confirmations, not predictions.
📌 Tags