$XRP has returned to a level that one analyst believes could decide its next major move. A fresh chart shared by crypto analyst ChartNerd (@ChartNerdTA) compares the current market structure to XRP’s breakout pattern before its 2017 rally.
The comparison centers on a familiar technical sequence rather than price alone. The latest move has brought XRP closer to a key retest that the analyst believes could shape the next stage of the trend.
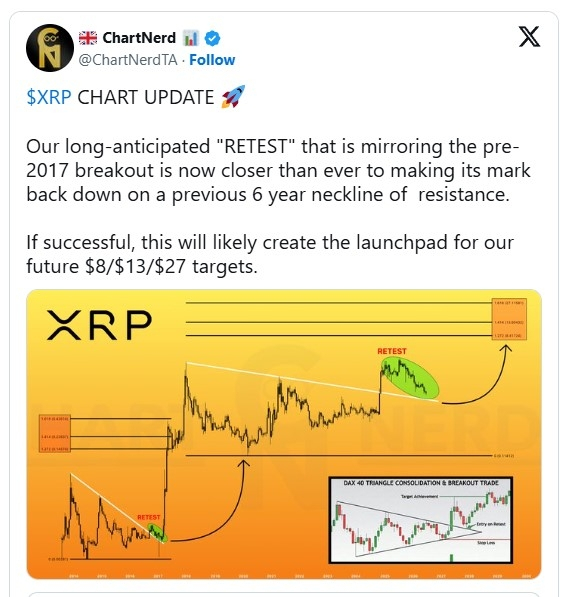
In his post, ChartNerd wrote that the long-awaited retest is now closer than ever to reaching a previous 6-year neckline of resistance. He added that a successful move could create the launchpad for future targets of $8, $13, and $ 27.
👉A Familiar Structure Returns
The chart compares two different periods in XRP’s history. The first shows when XRP broke above a descending trendline after years of consolidation. It then revisited that breakout level before beginning a strong advance in 2017.
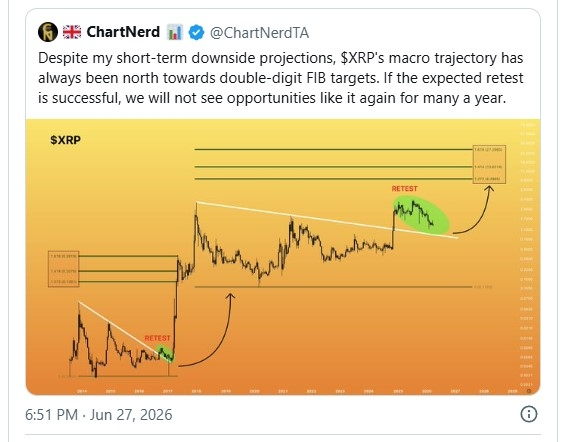
The larger pattern follows a similar sequence. XRP broke above another long-term descending resistance line in late 2024 when it experienced a massive rally. However, momentum shifted in 2025. The asset faced bearish pressure in the second half of the year, and XRP has spent months gradually falling toward that trendline.
The highlighted green area, labeled “RETEST” marks the zone where the analyst expects the asset to revisit the previous resistance, which could now serve as support.
👉Fibonacci Levels Set the Next Price Objectives
ChartNerd’s chart also plots Fibonacci extension levels above the current trading range. The highlighted targets sit at approximately $8.42, $13.60, and $27.12, corresponding to the 1.272, 1.414, and 1.618 extension levels.
An upward arrow extends from the retest area toward those levels, illustrating the path outlined in the analysis. The chart presents the retest as the final technical step before a possible continuation toward these new highs.
The comparison with the earlier XRP cycle also relies on the idea that a former resistance level can become support after a breakout. Technical analysts often monitor this type of price action because it can strengthen confidence in a breakout before momentum resumes.
👉Focus Shifts to the Retest Zone
For now, the chart is spotlighting whether XRP completes the anticipated retest. ChartNerd described this phase as closer than ever to revisiting the previous 6-year neckline of resistance.
If that sequence develops as shown on the chart, the analyst believes it could provide the foundation for the next advance toward $8, $13, and $27, a target the analyst has previously described as inevitable.
♥️♥️♥️🚀🚀🚀FOLLOW ME 🌍🌎🌏
Appreciate my work. 😍 THANK YOU ! 😘
👉👉👉If You follow me, I'll follow you back as MutualFollow 💥✨🚀🚀🚀🚀🚀
MAKE YOUR ACCOUNT GROW !!! 🌍🌎🌏💥🚀