Everyone keeps calling this an AI bubble... but the actual data shows we are NOT even close to the stage where bubbles burst.
History says bubbles collapse only when everyone believes they will never collapse. Right now, we are in the opposite phase.
Major Bubbles Follow the Same Pattern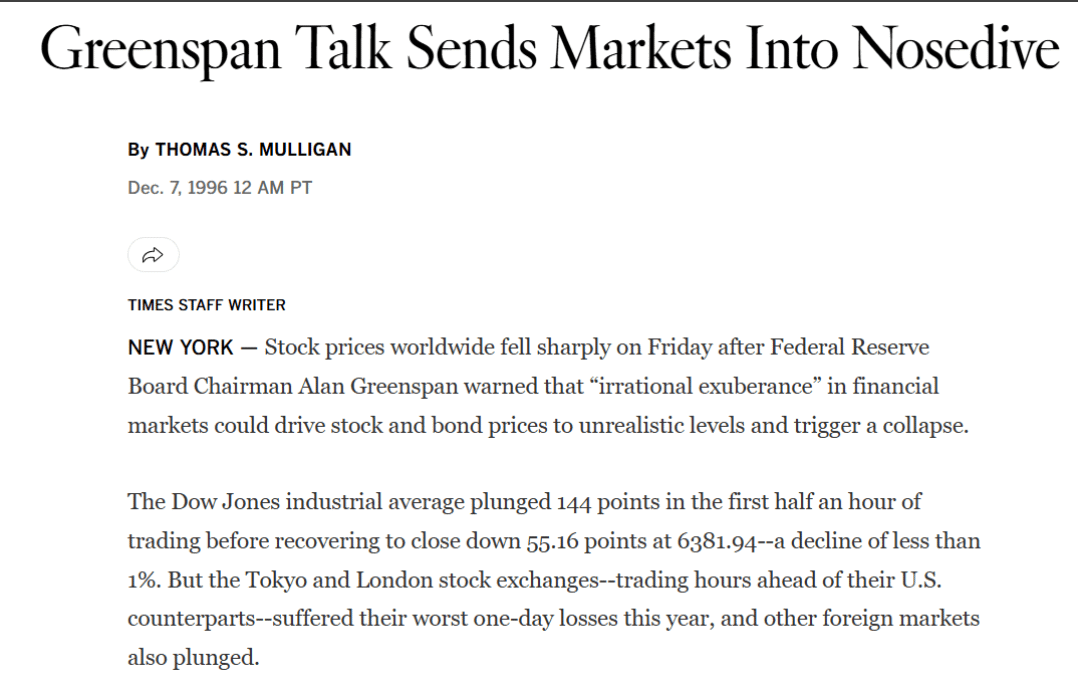
If you study every major bubble: Dot-com (1995–2000), Housing (2005–2008), China (2013–2015) there is one common pattern:
Warnings come YEARS before the real top.
Economists warned about tech stocks in 1997.
The bubble burst in 2000.
They warned about US housing in 2005.
The crash came in late 2007–08.
Early warnings NEVER kill the bubble.
They simply mark the beginning of its acceleration phase.
Why People Think AI Is a Bubble
People have been screaming market bubble:
OpenAI hype
NVDA rally
US government investments
Massive speculation
But just like the dot-com era, this phase is where liquidity, capital, and optimism ramp up, not collapse. Bubbles end when confidence is absolute, not when fear is trending.
Google Trends Prove We Are Not at Peak
If you check Google Trends: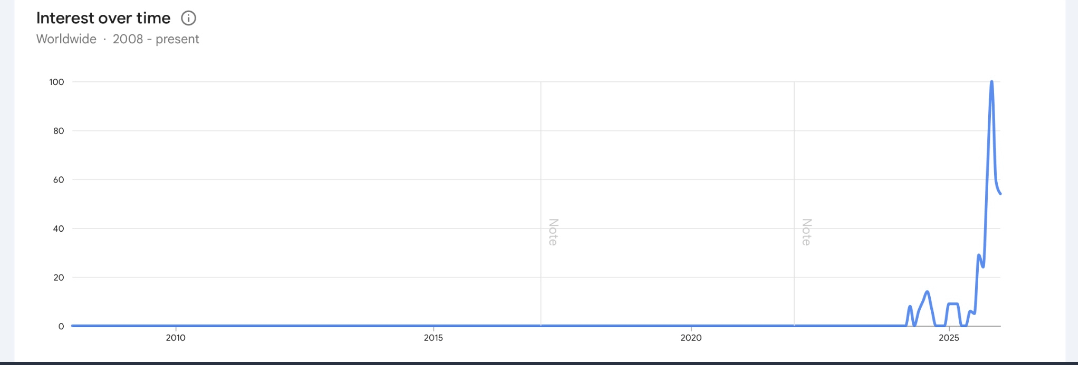
AI bubble searches are still high. That means people are expecting the crash. And when everyone expects a crash, bubbles usually don’t burst. The real danger zone is when search interest disappears when everyone believes the bubble is unbreakable.
We are not there yet.
Nasdaq Data Shows We Are Early, Not Late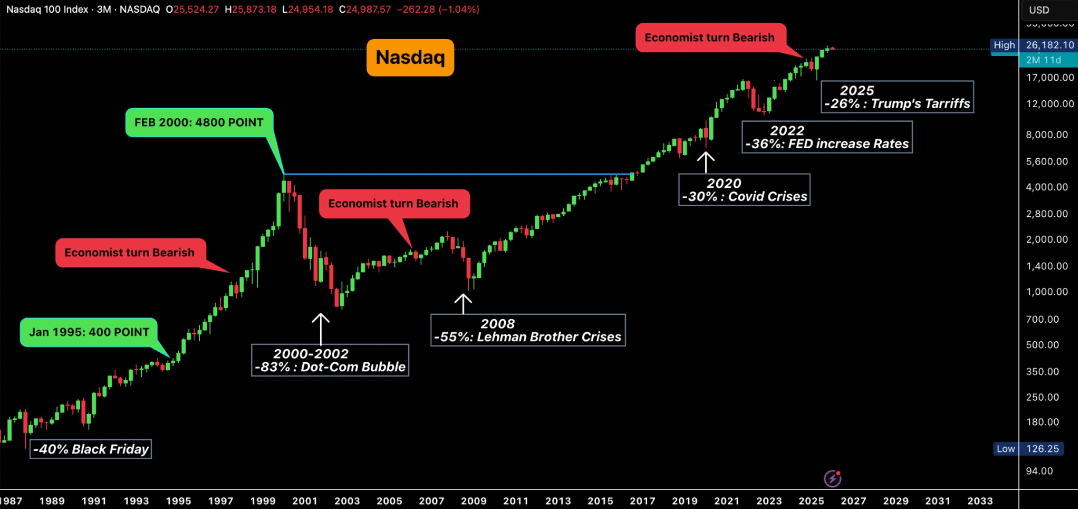
While people call today’s market rally a bubble, the actual data says we’re nowhere close to a final peak. Nasdaq has gained only ~88% in the last 5 years. During the real dot-com mania, Nasdaq went 12× in five years (from ~400 to ~4800).
And the historical chart shows something important:
Economists turned bearish years before the real top
Warnings came early, but the bubble kept expanding
Even after crises, tech resumed its long-term path
True bubble peaks form only when public confidence is absolute
Right now, we’re still nowhere near that stage.
Valuations Are High, But Not Dot-Com Extreme
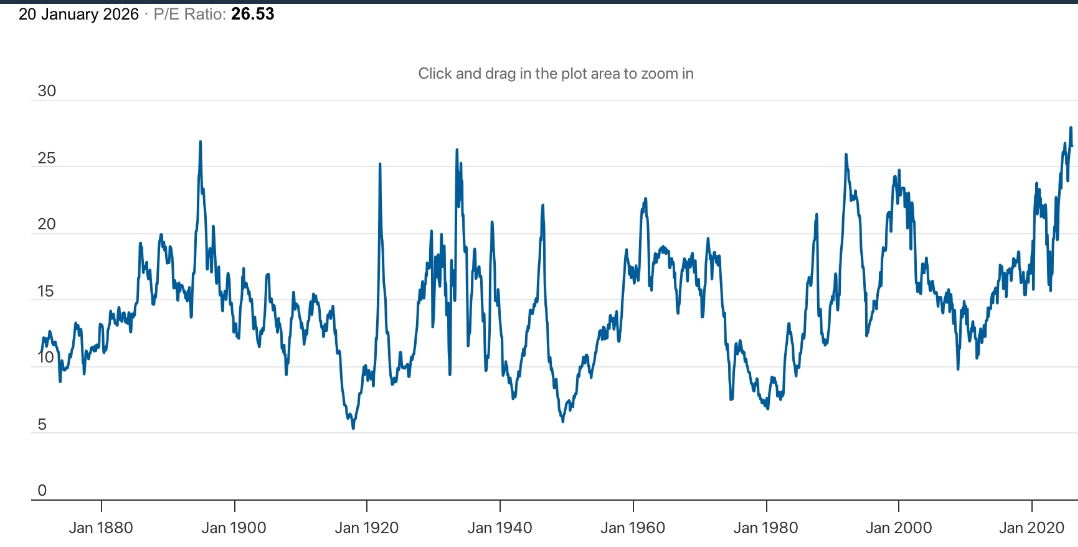
Valuations also show we are not at dot-com levels:
Dot-com Nasdaq P/E ≈ 60×
Today’s Nasdaq P/E ≈ 26×
S&P 500 P/E is high (~40), but still below historic extremes
These are elevated valuations, but not at the levels where bubbles usually burst.
Margin Debt Shows Bubble Still Building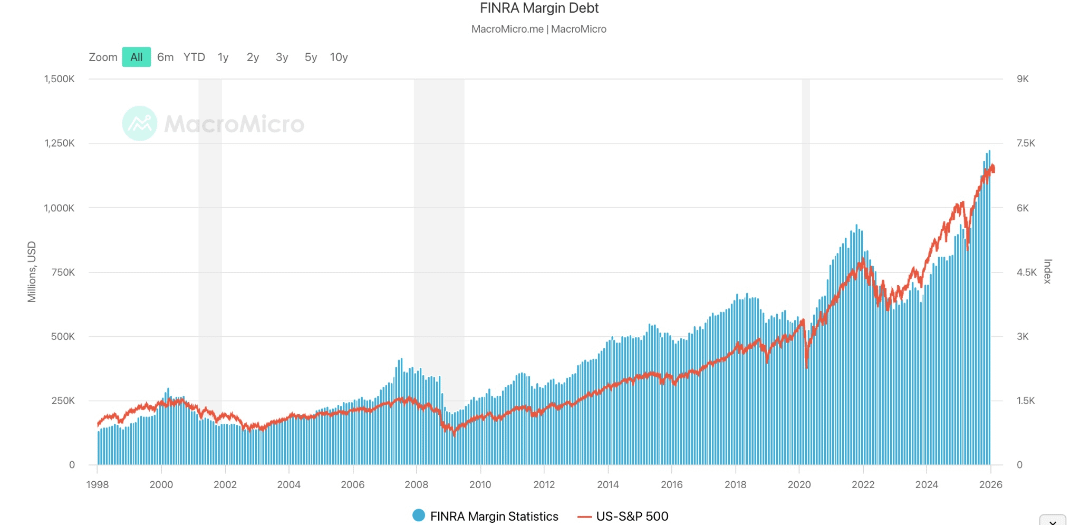
Margin debt which shows how much leverage investors are using, is at a record $1.1 trillion.
This is the highest in history. But historically, bubbles burst only after leverage starts falling sharply. Right now, leverage is still rising, which means the speculation cycle is still ongoing.
Volatility Signals Fear, Not Euphoria
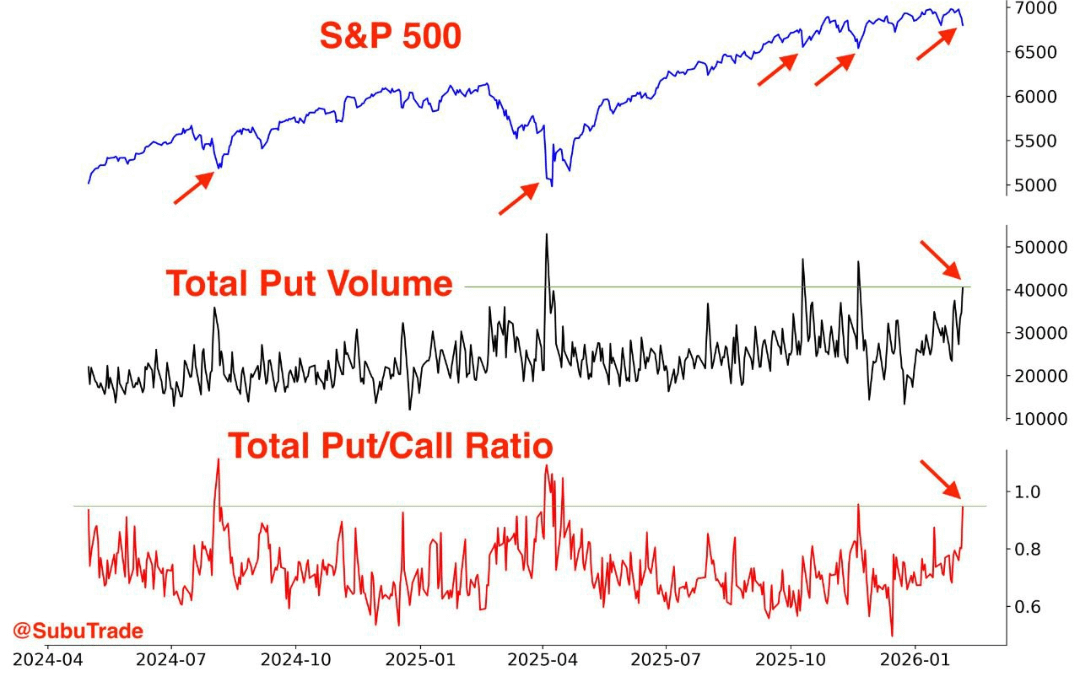
Trading volume and volatility also don’t match a final bubble phase.
Every time tech falls, VIX jumps sharply (20 → 28). Put option buying spikes heavily on every dip. A real bubble top usually shows the opposite:
low volatility, low put buying, and high confidence.
Right now, confidence is low and fear is high.
S&P 500 Equal-Weight Index Confirms This Isn’t a Full Bubble
A very important detail: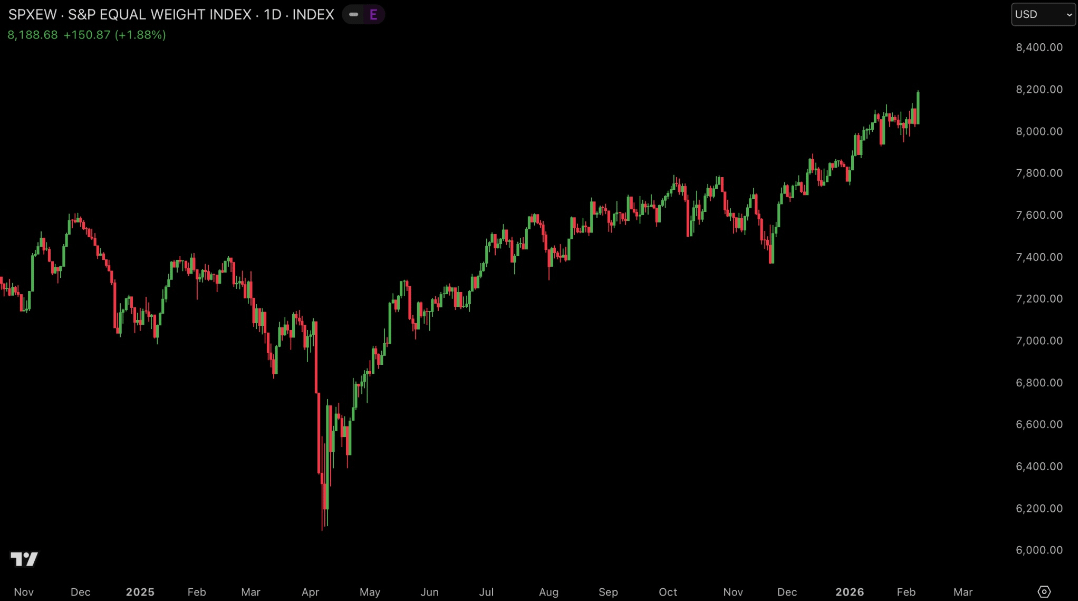
The S&P 500 equal-weighted index has been up only 10% the past year. That means the rally is coming mainly from a handful of mega-caps like:
Nvidia
Tesla
Apple
Google
Amazon
A true bubble peak needs full-market participation. That is not happening yet.
Macro Cycle Supports a Longer AI Runway
If we look at long-term macro conditions, they also support a longer bubble cycle:
The Fed has started to ease with T-bill purchases, which historically boosts valuations.
Trump policies aim to bring global capital back to the U.S., which means more liquidity.
US federal debt is projected to hit $50–$55 trillion by 2029, and this money ultimately flows into the economy.
Global liquidity injections from Japan, China, and the U.S. will support risk assets.
These conditions historically extend bubbles, not end them.
Sentiment Is Nowhere Near Peak Optimism
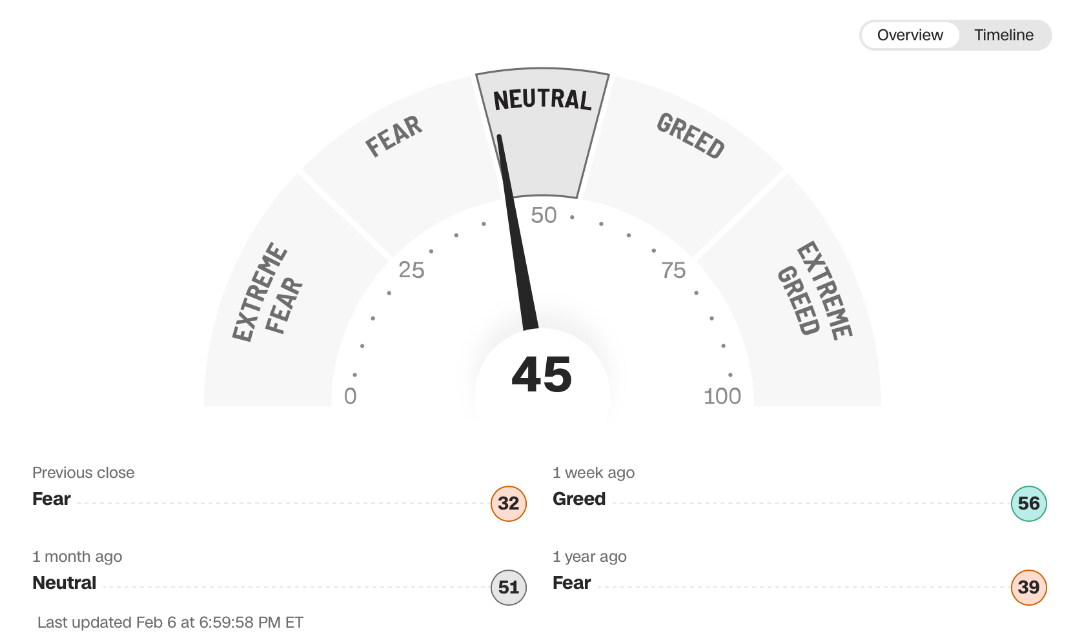
Sentiment also shows we are not close to peak optimism.
Wall Street is divided. Retail investors fear every correction. Put open interest spikes every time equities fall. This is a classic early-to-mid bubble phase sentiment.
All Data Confirm We’re Not at the Late Stage Yet
All charts also support the idea that we haven’t hit the late-stage bubble dynamics:
Corporate earnings (especially Nvidia, Microsoft) still support valuations
Nasdaq is rising but not at dot-com “parabolic” levels
Equal-weight S&P is flat, meaning the market is not overextended
Market funding remains strong and still increasing
All these indicate that the stock market bubble is building, not peaking.
What the Full Dataset Actually Shows
✔ Nasdaq nowhere near dot-com valuation extremes
✔ Nasdaq return multiples far below past bubble peaks
✔ Margin debt rising, not collapsing
✔ Liquidity expansion ahead
✔ Equal-weight S&P flat
✔ Heavy concentration in a few names
✔ High fear, low complacency
✔ AI investment cycle only accelerating
✔ Google searches reflect fear, not mania
All of this shows: The bubble is real, but it is not close to bursting.
Historical Timing Suggests the Peak Is Years Away
If we follow the historical timeline:
Dot-com
Warnings: 1997–1999
Burst: 2000–2001
Housing
Warnings: 2005–2007
Burst: 2008
AI
Warnings: 2023–2025
Likely peak: 2027–2028
This is the most realistic timeline based on valuations, liquidity, sentiment, and historical bubble cycles.
This is why we remain optimistic about the crypto market. We are definitely going through a correction, but the upcoming liquidity catalysts are too strong.
Conclusion
We will still see corrections, volatility, and pullbacks. But nothing in the data suggests an immediate collapse. Everything indicates that the cycle is still building strength. If this follows past patterns, the true mania phase, the stage where everything starts going vertical, is still ahead.