 The chart for $XRP is flashing a high-conviction setup on the 1H timeframe. After a period of consolidation, we are seeing a "Descending Channel" pattern reaching its exhaustion point. If history repeats itself, we are looking at a potential trend reversal very soon.
🔍 Technical Deep Dive
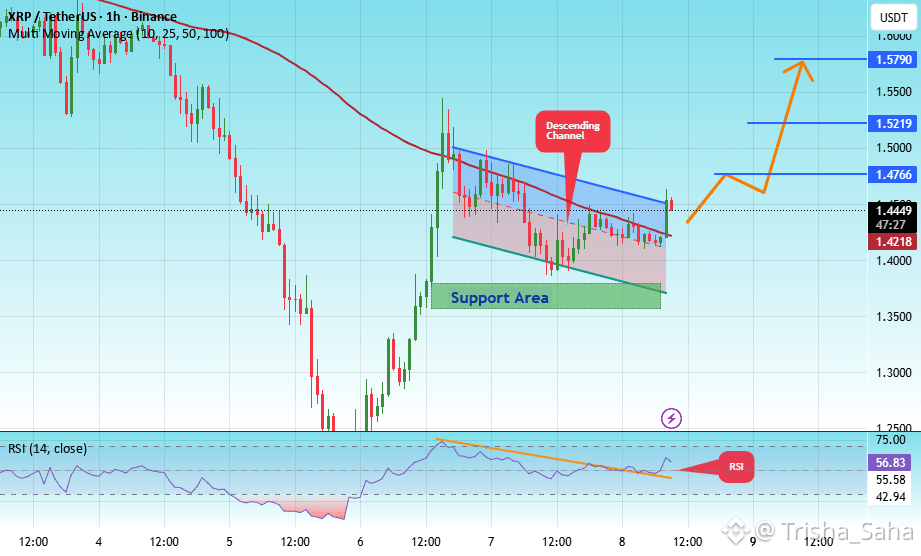
Descending Channel: Price action has hit the lower boundary of the channel. Typically, this is where buyers step in to force a breakout or a strong retest of the upper resistance. 📉➡️📈
RSI Oversold Bounce: The Relative Strength Index (RSI) is deep in the "buy zone." We’re seeing early signs of an upward curve, suggesting the bears are losing steam.
Rock-Solid Support: The 1.36 green zone has acted as a historical floor. Every time XRP touches this level, it tends to bounce back with volume. 🛡️
MA 100 Consolidation: The price is currently stabilizing just above the 100-period Moving Average, providing the necessary fuel for an impulsive move higher.
🎯 The Strategy (Spot Trading)
For those looking to catch the next wave, here are the key levels:
Entry Price: 1.44
Target 1: 1.47 🟢
Target 2: 1.52 🟡
Target 3: 1.58 🔴
Stop Loss: Below the 1.36 support zone.
💡 Gold Rule: No matter how good the chart looks, never forget Money Management. Protect your capital, use a Stop Loss, and trade with a clear head! ⚖️
Do you think $XRP will smash Target 3 by the weekend, or are we staying in the channel? Drop your predictions below! 👇
