Based on the chart provided, here is a technical analysis of
SPXUSDT (likely the SPX6900 meme coin) on the 15-minute timeframe:
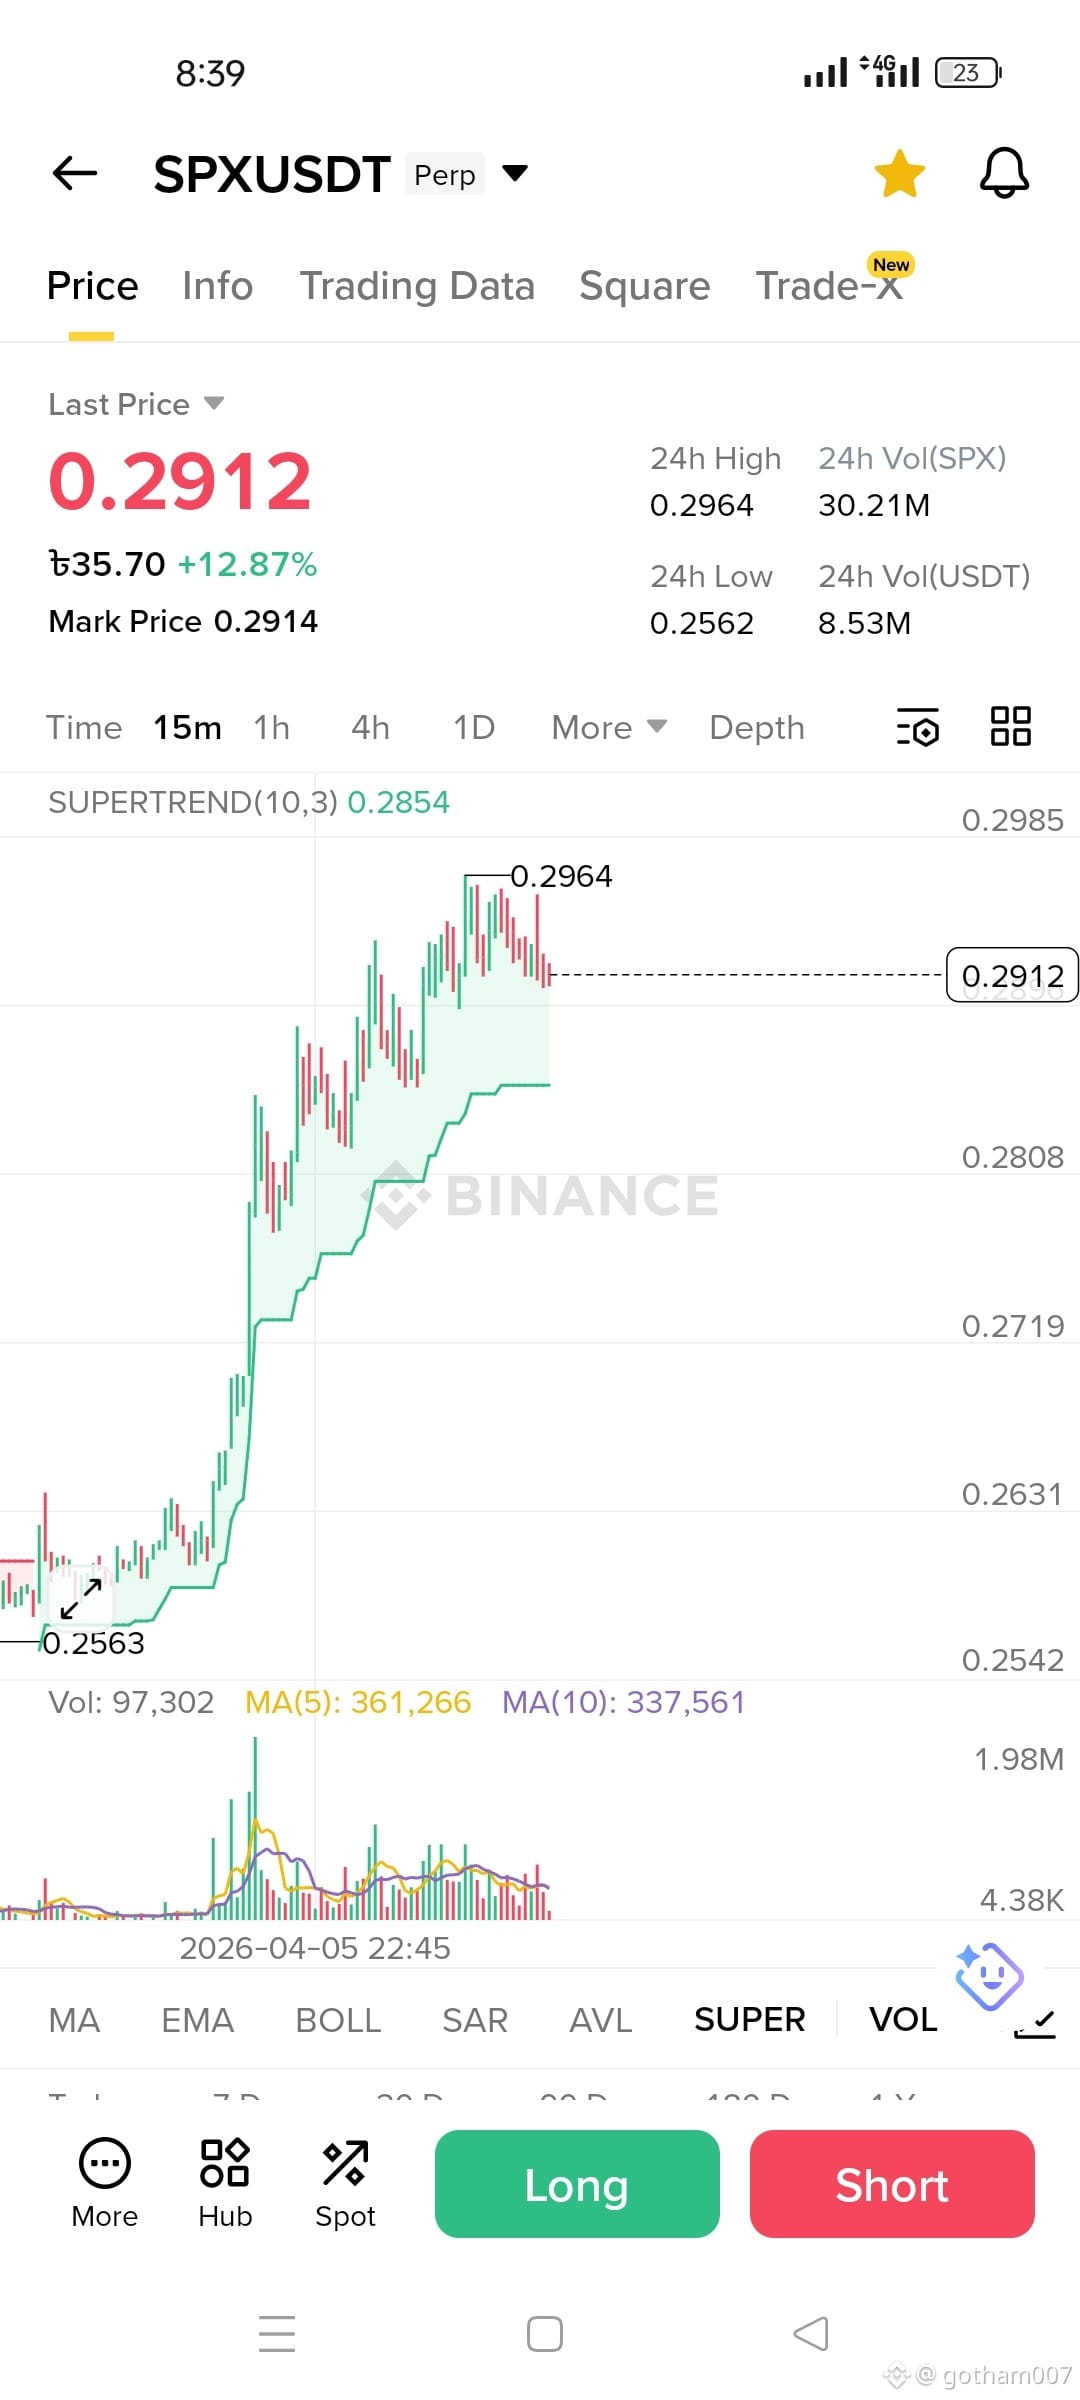
Market Snapshot
Current Price: 0.2912 USDT
24h Change: +12.87%
24h High/Low: 0.2964 / 0.2562
Volume (24h): ~30.21M SPX (~8.53M USDT)
Technical Indicators
Trend Analysis: The asset is in a strong short-term uptrend, characterized by a sharp impulse move starting around 0.2600.
Supertrend (10,3): Currently showing a bullish signal (green cloud), with the dynamic support level sitting at 0.2854. As long as the price stays above this, the uptrend is technically intact.
Volume: There was a significant volume spike during the initial breakout, followed by a slight cooling off as the price consolidated near the recent high of 0.2964.
Moving Averages: The MA(5) is at 361,266 and MA(10) is at 337,561, indicating high recent activity and supporting the upward momentum.
Key Levels to Watch
Resistance: 0.2964. This is the recent "24h High" and a local peak. A clean break above this could signal a continuation toward the 0.32–0.33 range.
Support: 0.2854 (Supertrend line) and 0.2800 (psychological level). If the price fails to hold 0.2854, it may enter a deeper correction toward the 0.2562 support