June 5, 2026, is destined to be etched in the annals of global financial markets.
On this day, the Dow Jones took a nosedive of 1.35%, while the S&P 500 plummeted a staggering 2.64%, marking the largest single-day drop since October 2025. The Nasdaq Composite was hit hard, down 4.18%, recording its worst performance in over a year. The Philadelphia Semiconductor Index saw its losses widen to 10% at one point, with the semiconductor sector experiencing a rare collective crash—Nvidia dropped over 6%, Broadcom nearly 8%, AMD close to 11%, and Micron Technology tanked more than 13%.
However, the most chilling aspect is not the magnitude of the drop itself but the breadth of the fallout from this crash.
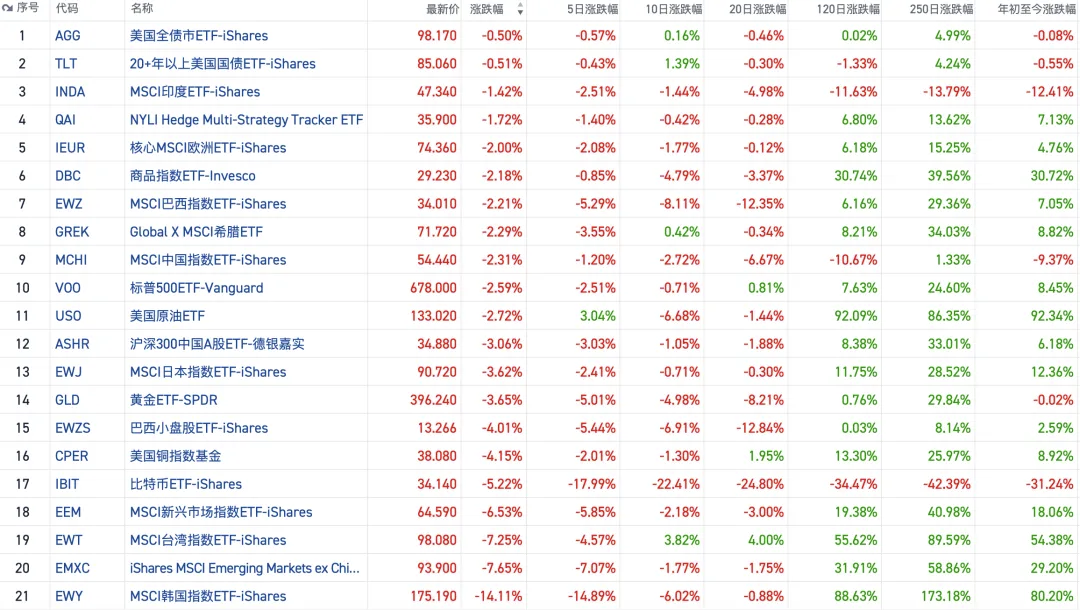
The commodity market has completely collapsed. Spot gold fell more than 3% in a single day, dropping below $4,330 per ounce, erasing all gains for the year; spot silver plummeted 8%, directly breaking through the $70 mark. The cryptocurrency market is even more tragic—Bitcoin has fallen below the psychological barrier of $60,000 for the first time since October 2024, down more than 50% from the historical peak of $126,000 set in early October last year. Within 24 hours, the total liquidation amount across all cryptocurrencies exceeded $1.5 billion, affecting more than 300,000 traders, with long positions accounting for over 80%. Crude oil, bonds, tech stocks, cryptocurrencies—almost all risk assets were sold off simultaneously at the same moment.
Panic spread rapidly on social media: "Is the bull gone?" "This time it's different?" "Should we liquidate?"
But what this article wants to tell you is: rather than panicking, why not first ask—do we really understand this drop?
1. Non-farm "blowing away expectations": the misplaced causal chain
Let's first look at the most direct trigger: non-farm data.
On June 5, before the market opened, the U.S. Labor Department released data showing that 172,000 non-farm jobs were added in May, far exceeding the market's previous expectation of 85,000. Meanwhile, the April data was significantly revised up from the initially reported 115,000 to 179,000, and the average employment level over the past three months has returned to pre-COVID outbreak norms. The unemployment rate has remained stable at 4.3% for the third consecutive month.
The White House quickly called this data "proof of Trump's economic prosperity." Trump himself posted on social media, stating: "The recently released employment report is very strong, and the stock market should rise, not fall. It has always been this way for the past 200 years. Economic growth does not mean inflation!"
However, the market's reaction was completely opposite to the president's expectations—after the data was released, stock index futures fell sharply, and spot gold dropped over 1%.
What exactly is the market afraid of?
The answer is actually quite simple: the market isn't afraid of bad news, it's afraid of good news turning into bad news. Strong employment data means two things: first, the U.S. economy remains resilient and far from recession; second, persistently high inflation pressure is nearly impossible to dissipate on its own in the short term. The combination points to the same conclusion— not only is the Fed unlikely to cut rates, but it may even be forced to consider rate hikes.
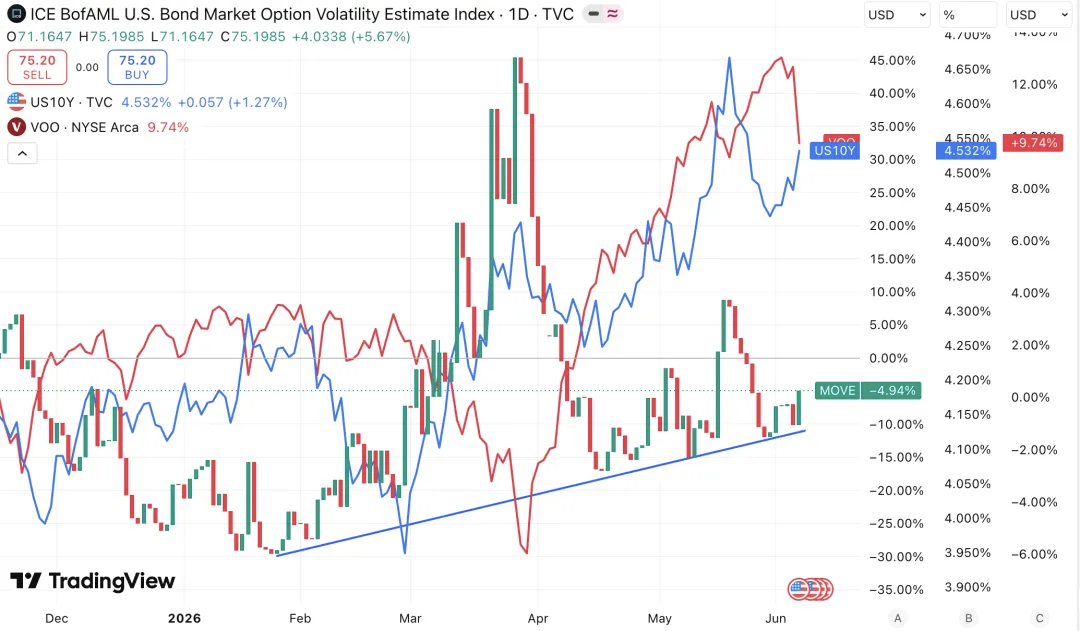
The pricing changes in the interest rate futures market are the most direct evidence. After the employment data was released, the market's expectation for the Fed to raise rates in December skyrocketed from about 48% to between 63% and 70%. Traders not only started pricing in a rate hike this year but also brought forward the expectation for the first hike to before the end of January next year. Goldman Sachs, in its latest research report, completely abandoned its prediction for rate cuts in 2026, raising the tail risk probability of a rate hike from 10% to 20%.
From this perspective, the logic behind the market's crash seems clear—strong data → rising rate hike expectations → valuation pressure → crash. But if we delve deeper into the internal structure of this non-farm data, we will find that things are far from simple.
2. Exposing that unreliable non-farm report
This non-farm data needs to be treated with caution for two layers of consideration.
First layer: Seasonal factors are unsustainable
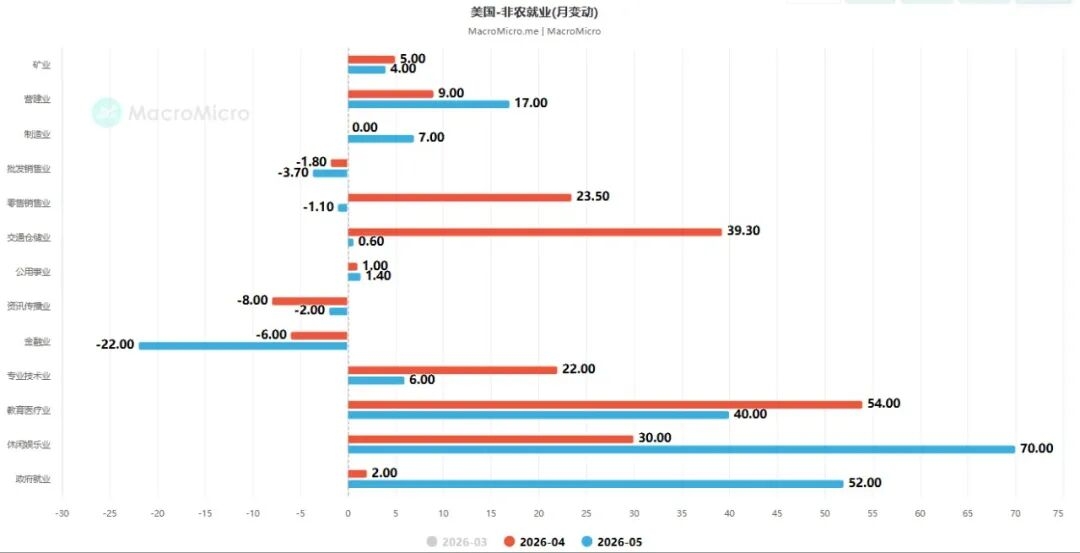
Among the 172,000 new non-farm jobs added in May, the leisure and hospitality industry contributed 70,000 jobs, a number significantly higher than the monthly average increase of 14,000 over the past 12 months, with an additional 48,000 jobs in dining and bars. The market generally attributes this surge to seasonal hiring in preparation for the World Cup in the U.S.—in other words, this is a one-time, unsustainable demand for labor.
Local government employment also showed an abnormal increase of 55,000 people, ending the previous downward trend. Meanwhile, the financial sector saw a reduction of 22,000 jobs, with a cumulative shrinkage of over 100,000 from the peak levels in May 2025.
In other words, the incremental composition of this "massively exceeding expectations" employment data mostly comes from seasonal factors and government hiring, while the privately owned sector, especially the financial and tech industries, which are most sensitive to interest rates, still shows a relatively weak employment situation. The market's linear extrapolation—"strong employment means strong consumption means stubborn inflation means rate hikes must happen"—seems overly simplistic in light of this structural detail.
Second layer: There have been multiple precedents of 'talk not matching action'
The U.S. Labor Department's non-farm data has a tradition of repeated downward or upward revisions. There have been many instances of "initial data significantly deviating from final values," where the market reacts violently based on the initial data, only to later receive a disruptive correction. This characteristic means that, beyond the structural doubts about the data itself, its reliability is also worth questioning.
In this light, the "Black Friday" on June 5, 2026, is largely an "overreaction" by the market to the data: an employment report magnified by one-time factors, catalyzed by panic over rate hike expectations, triggered a market-wide sell-off.

Three layers of logic behind "Black Friday"
If it were just the non-farm data exceeding expectations, the market wouldn't have collapsed so completely. The reason behind the simultaneous slaughter of stocks, bonds, and cryptocurrencies has deeper layers worth unpacking.
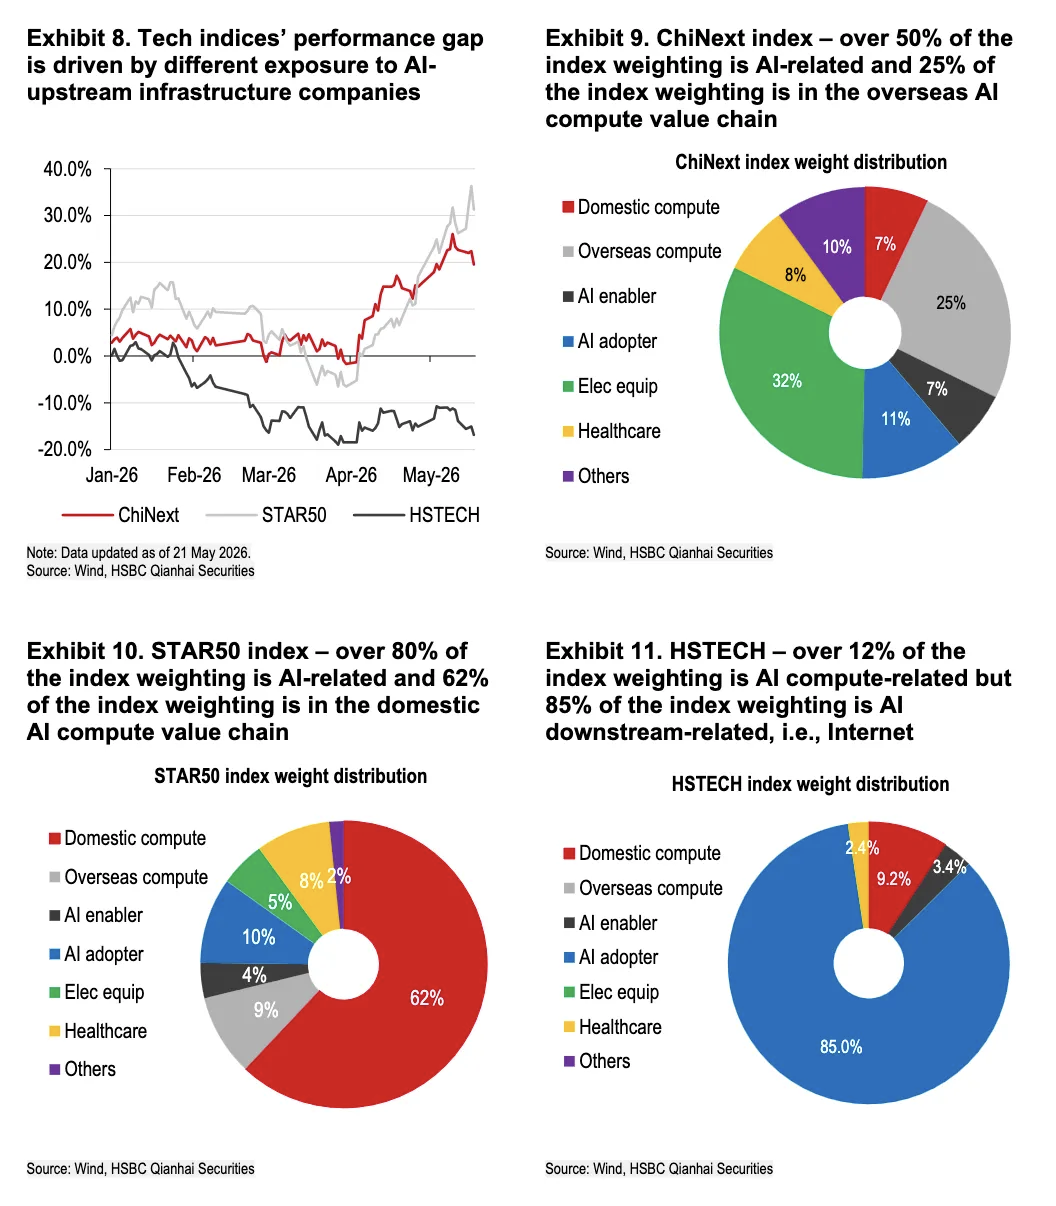
First, the market has long been in a "fragile balance" state of extreme valuation.
The core engine of this round of the U.S. stock bull market is the AI sector. Within the AI sector, valuations have been pushed to extremely high levels, and the market's definition of "good" has become extremely harsh—you don't just need to be "good," you must exceed expectations; you don't just need "growth," you must have accelerating growth. This is why Broadcom's earnings report, which might have been considered good a year ago, became the catalyst for a sector-wide sell-off at the current emotional peak. This isn't because the company is in trouble, but because the market's high expectations have run too far ahead of reality; the essence of a bubble isn't that the company is bad, but that the price is too high.
Second, Bitcoin's "double curse" highlights its awkward position in the current macro landscape.
Many people don't understand: isn't Bitcoin "digital gold"? Isn't it supposed to be a safe haven? Why does Bitcoin drop even harder than U.S. stocks? The core cognitive correction is this: in the macro environment of 2026, Bitcoin is not a safe haven asset, but an amplifier of global risk appetite. The main driving force behind this round of the crypto bull market isn't retail investors or so-called "crypto natives," but traditional financial institutions entering through ETFs. The risk appetite of these funds is highly correlated with U.S. stocks—when the AI bubble cools, when macro expectations turn hawkish, and when U.S. Treasury yields soar, institutions' first reaction is to reduce overall risk exposure, and the assets with the worst liquidity and highest volatility are naturally the first to be cut. Data shows that the U.S. spot Bitcoin ETF has seen net outflows for 13 consecutive trading days, with a total outflow approaching $4.4 billion, setting a record for the longest continuous withdrawal since its launch in early 2024.
If Bitcoin is a loudspeaker in a bull market cycle, then in an environment of tightening liquidity, it is the most fragile echo chamber.
Third, the geopolitical black swan is still hovering.
Since the Strait of Hormuz was effectively closed due to conflict at the end of February, news of U.S.-Iran negotiations has been tugging at the global energy market. The ceasefire news between Lebanon and Israel briefly boosted market optimism for a de-escalation in the Middle East and U.S.-Iran talks, putting pressure on oil prices—by Friday's close, WTI crude fell about 2.7% to $90.54 per barrel. However, the core contradiction has never truly been resolved: if a final agreement is reached, and Hormuz reopens, oil prices could fall further; but if negotiations break down or tensions escalate again, oil prices will receive a new strong catalyst.
The transmission chain is: rising oil prices → rising inflation expectations → the Fed is even less likely to cut rates → risk assets come under pressure. And the starting point of this chain is not Wall Street, not the Fed, but on the other side of the globe. As long as this uncertainty remains unresolved, the prices of any risk assets will carry a deep geopolitical discount.
Fourth, time is letting the bullets gradually land.
Interest rate changes have about a quarter's lag in their impact on real economic activity. Currently, with U.S. Treasury yields at high levels, the pressure of borrowing costs for businesses and consumers will gradually start to manifest in the coming months, inhibiting economic growth momentum. The market's violent reaction is largely a preemptive digestion of this "future pain."
Moreover, the narrative around "Fed rate hikes" itself may be an overreaction. Indeed, the employment data exceeded expectations, collapsing the foundation for rate cut expectations, but the threshold for triggering rate hikes is actually very high—requiring the unemployment rate to drop below 4% or real wages to continue accelerating, both of which are not conditions present in the current macro data. Therefore, the pricing of "rate hikes this year" in the current interest rate market is largely a linear extrapolation of an exceptionally strong employment data point, which has a significant gap from the Fed's actual policy inertia.
4. Not an end, but a restart
Now the question arises: is this drop a "shakeout" or a "reversal"?
If we broaden our perspective, we will notice a historical pattern: similar "strong data killing expectations" adjustments are not rare in the market. Whether in 2018 or 2022, each time, the market reacts violently after data is released; each time, someone shouts the end of the bull market; each time, someone cuts losses and leaves. But each time, at the panic's nadir, assets with real value will eventually slowly climb back up. Data will fluctuate, policies will change, emotions will reverse—these will all pass.
Another noteworthy fact is that this drop has a clear structural characteristic: a lack of systemic risk. It is not the subprime mortgage crisis of 2008, nor the liquidity crunch of 2020, and there is no financial giant's sudden collapse—this is merely a typical, healthy "valuation digestion" process: AI has risen too much, it needs to drop; macro expectations have changed, adjustments are needed; leverage has increased, liquidations are necessary.
Ultimately, the "Black Friday" of June 5, 2026, is a mirror reflecting three market natures:
First, the market's pricing mechanism is not linear. A piece of employment data filled with seasonal factors, interpreted unilaterally as "inflation intensifying → forced rate hikes," triggered a market-wide stampede. Rather than saying it's the impact of the data itself, it’s more accurate to say that the market was already at a sensitive edge of self-feedback, where any wind or grass movement could trigger a chain reaction. In such a nonlinear system, the simple concepts of "good news" or "bad news" are no longer sufficient to describe the market's response function—the key is how the interplay between emotions, positions, and expectations is triggered by a single piece of data.
Second, the market is the best risk manager. The victims of this drop were almost all participants in high-leverage trading—over 80% of long positions were liquidated, meaning a large amount of capital using high leverage to chase up has been cruelly wiped out. The market's self-repair mechanism is at work: it's not "broken," but it's "restarting." Those crowded positions piled up from frenzy, and the risk management discipline forgotten in greed, have been repriced in this drop. From a long-term perspective, this is a necessary path for the market to restore health and find a new equilibrium.
Third, the ability to distinguish short-term noise from long-term trends is key to navigating cycles.
At this juncture, rather than being swept away by panic, it’s better to ask yourself some more fundamental questions:
· Has the direction of geopolitics been fully priced in by the market?
· Is the structural demand of the AI industry chain invalidated by a day's drop?
· Between the Fed's actual policy inertia and the speculation in the interest rate futures market, who is more likely to err?
If you can make sense of these questions, you won't become a slave to emotions in the moment of a crash. For those investors who maintain clarity during rises and uphold discipline during falls, every panic is not an end, but a starting point for reassessing, reallocating, and finding the next opportunity.
Every adjustment round will eliminate a batch of people, and inevitably will create another batch. The only difference is: can you tell apart what is short-term noise and what is long-term trend?$BTC