
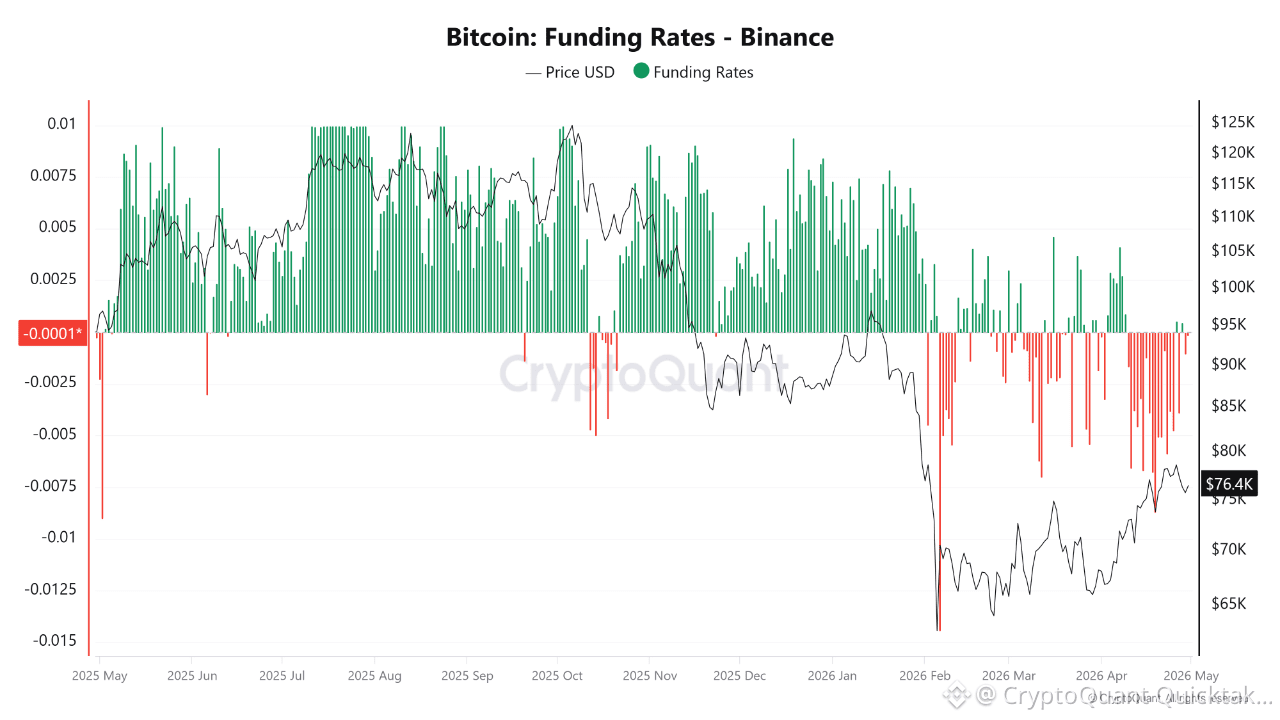
The relationship between price and funding rates on the chart tells a very clear story. For a long period, funding remained positive and elevated, indicating that the market was heavily long biased, with a crowded bullish expectation. During this phase, price also moved higher, but without strong spot demand support rather, it was largely driven by derivatives. After that, funding sharply flipped negative, and price experienced a significant drop. This is a classic long liquidation phase.
In the current structure, funding has been staying in negative territory for an extended period. Meanwhile, price has bounced from the lows but remains weak and choppy. This suggests that the short side is now dominant in the market. However, despite this, price is not falling aggressively. In other words, there is selling pressure, but it lacks strong continuation.
This is important because when funding stays negative while price holds relatively stable, it creates the conditions for a potential short squeeze. If such a squeeze happens, it wouldn’t be surprising.
In summary, the market is not producing a clear directional trend right now. Leverage positioning is skewed toward shorts, but this pressure is not strong enough to push price lower. Instead, price action reflects a balance phase and liquidity collection behavior. In simple terms, traders are increasingly positioned on the wrong side of the market which is why short positions should be approached with caution.
One key point to emphasize: what matters most is identifying the level from which this potential short squeeze could begin.
It’s also important to explain why we focus on Binance data. Binance hosts the largest share of derivatives volume, making its funding rates one of the most reliable indicators of market sentiment. Additionally, since leveraged trading is highly concentrated there, it serves as a benchmark for understanding liquidation dynamics.
Written by PelinayPA