

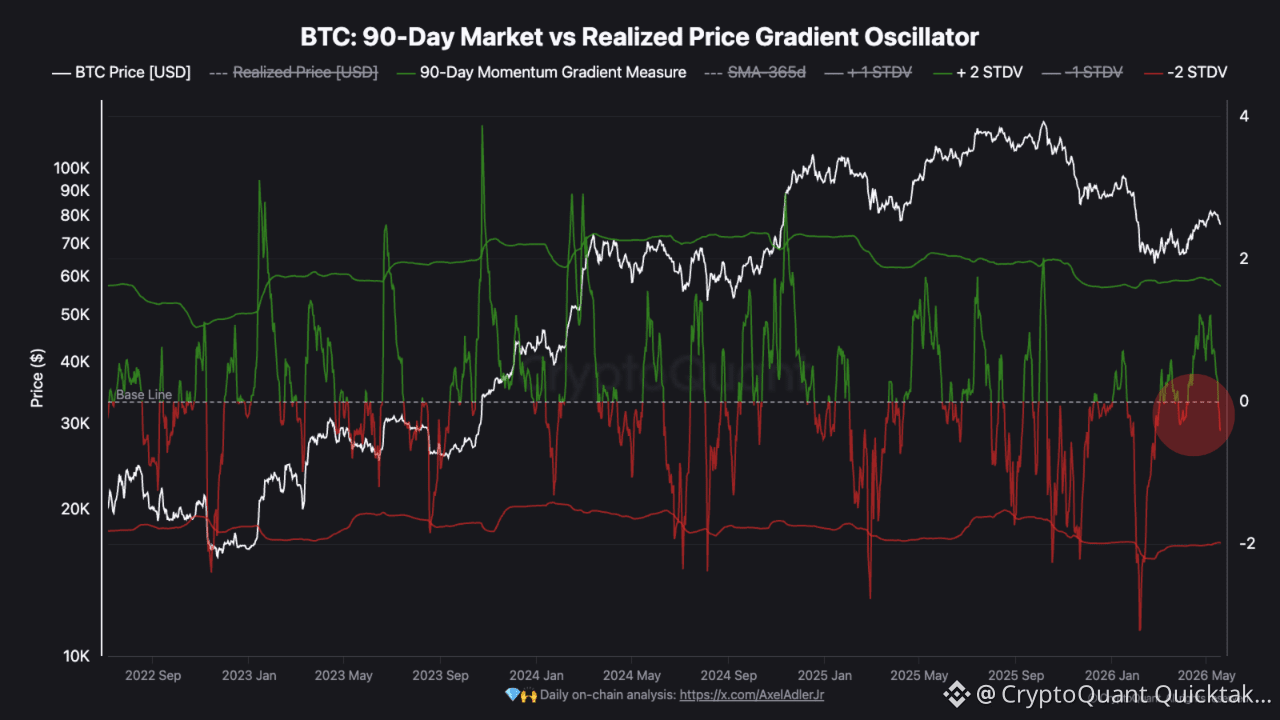
The 90-Day Market vs Realized Price Gradient Oscillator is hovering right around the base line. After weeks of positive momentum signals pushing this indicator back from deeply negative territory, faster components are now curving downward again.
📊 The Momentum Fight
Long-term momentum indicators triggered positive over the past two weeks. That was real. But this week, shorter-term momentum components are already flipping back to negative. Price is still holding above $77K, but underneath, faster oscillators are losing steam.
What we want to see here is the gradient holding the base line. That zero level acts as the dividing line between a market that's grinding toward recovery and one that's rolling over. If this indicator drops below and reaches the lower standard deviation bands, the drawdown deepens. Holding the middle is not just "nice to have." It's the minimum requirement for continuation.
🔍 The Macro Overlay
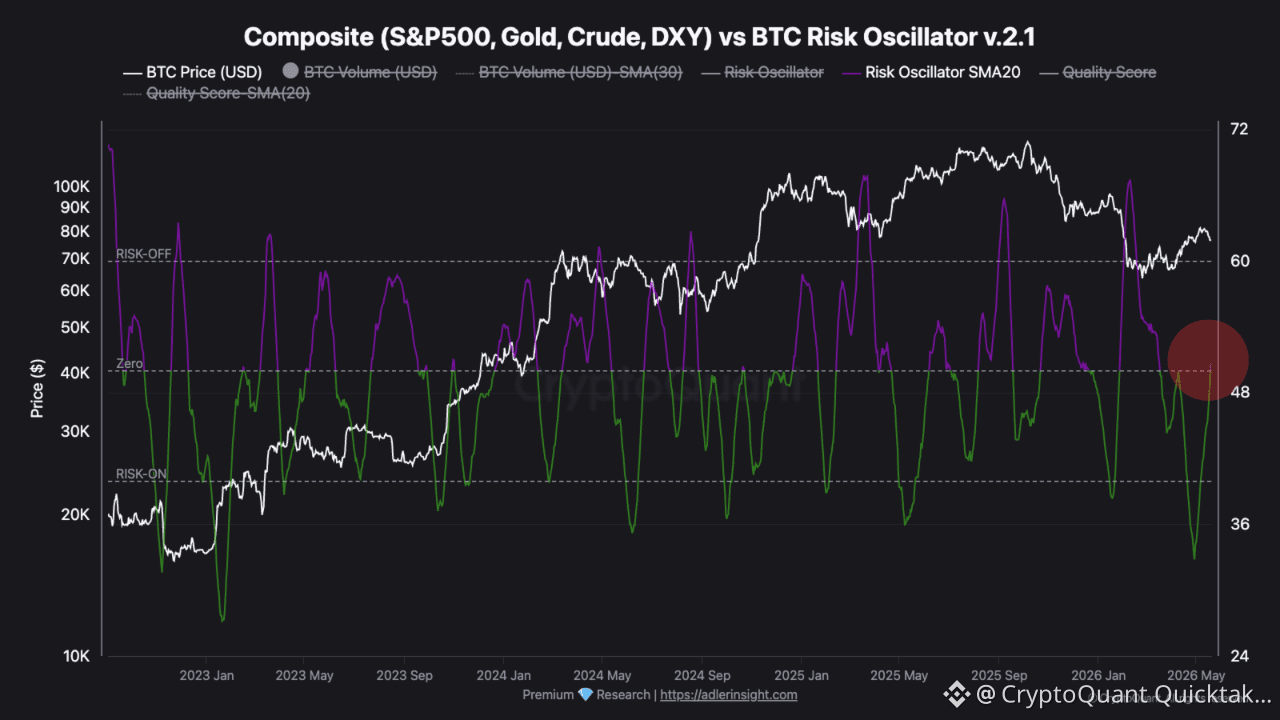
On the macro side, the Composite Risk Oscillator (S&P500, Gold, Crude, DXY) just flipped below its risk-off threshold. The SMA20 crossed down into risk-off territory, sitting around 67. Money is rotating out of the crypto market, or at the very least, slowing its inflow.
This is not exactly new for anyone paying attention over the past week. But the indicator only just confirmed what price action was already hinting at. And when this oscillator turns risk-off, it has preceded strong moves to the downside in the past.
⏳ Putting It Together
Two independent indicators telling the same story from different angles. Momentum trying to hold support while macro risk appetite fades. The combination is clear in its positioning: momentum slowing down, struggling to maintain any strength, and the broader environment switching cautious again.
Will these hold as support and turn into a false signal before continuation? Possible. But that depends on spot demand stepping in and derivatives cooling off, neither of which we're seeing yet.
Eyes wide open!
Written by RugaResearch