May 23, 2026 — Over $657 million in forced liquidations shook the market as Bitcoin flushed below the $77,000 handle. While retail sentiment is pivoting toward fear, high-timeframe structural analysts are identifying a textbook Weekly Double Bottom pattern. The validity of this macro recovery entirely hinges on a high-volume breach of the $80,000 "Whale Pivot".
+ 2
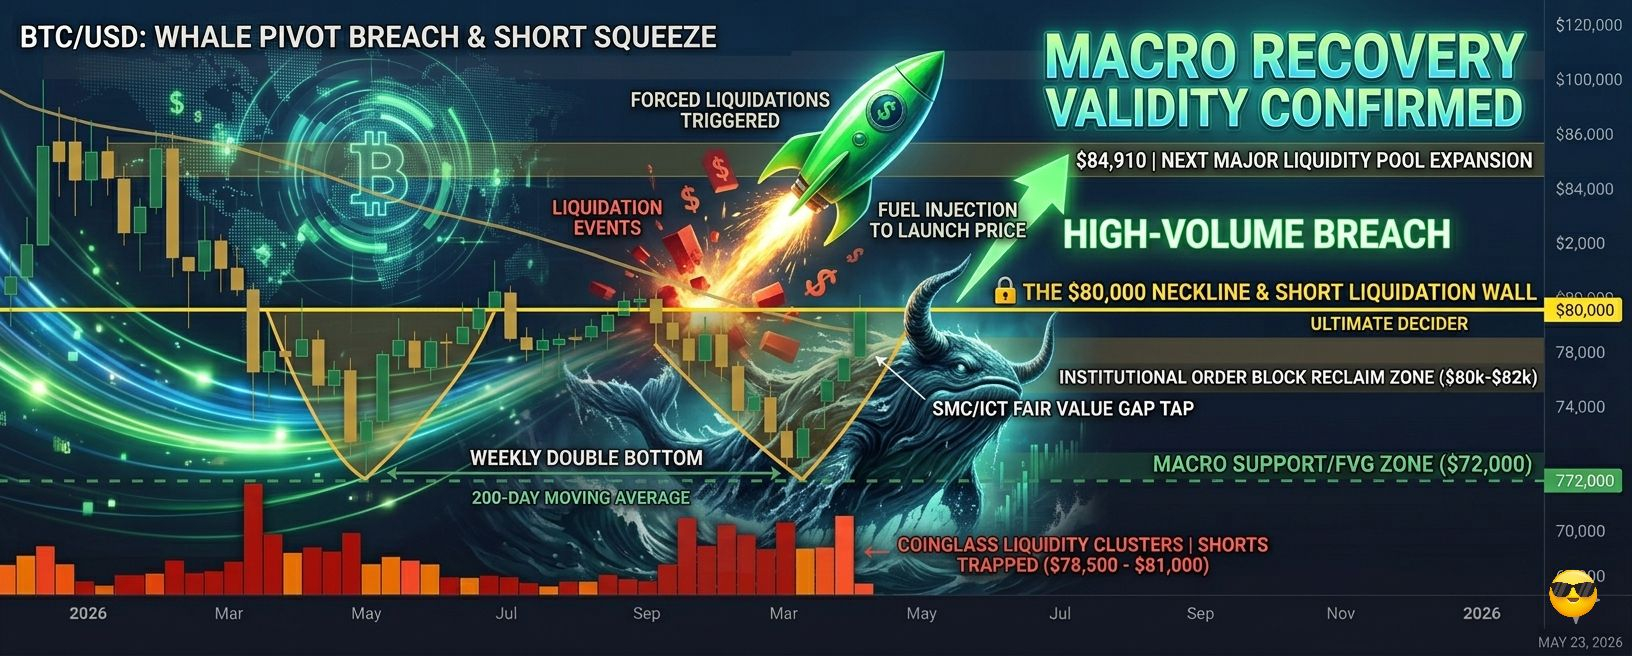
BTC/USD Weekly Double Bottom Macro Framework
$84,910 ───> Next Major Liquidity Pool Expansion
$80,000 ───> Psychological Neckline & Short Liquidation Wall
$76,800 ───> Current Consolidation / Fair Value Gap Zone
$72,000 ───> Macro Higher-Low Support / Ascending Channel Floor
1. The Double Bottom Structure: Defending Macro Higher-Lows
From a structural perspective, the recent correction has done significant healthy rebalancing.
The Twin Troughs: Bitcoin’s drop below $77,000 effectively tested the deeper liquidity pockets, solidifying a macro floor. This forms the second trough of a massive high-timeframe Double Bottom.
SMC/ICT Alignment: The structural price action successfully tapped into a weekly bullish Fair Value Gap (FVG) and an established ascending channel originating from earlier in the year. By keeping the dynamic channel floor near $72,000 unviolated, the structural market bias technically remains bullish on structural timeframes.
Re-Accumulation Behavior: Volume data signals institutional absorption near the lows, mimicking a standard Wyckoff re-accumulation phase before an upward breakout attempt.
2. CoinGlass Liquidity Clusters: The Short-Squeeze Rocket
The derivatives landscape shows a heavily lopsided building of leverage, favoring an aggressive upward squeeze if resistance breaks.
The Short Overhang: As traders grew increasingly bearish during the slide beneath $80,000, a massive cluster of trailing short stops and liquidity pools began stacking between $78,500 and $81,000.
Engine for Expansion: According to CoinGlass heatmaps, these clusters represent heavily leveraged short positions. If spot demand pushes the asset back over $78,500, it will trigger an initial wave of forced buybacks, acting as a fuel injection to launch price directly into the core $80,000 neckline resistance.
3. The Moving Average Wall: Reclaiming Institutional Order Blocks
Clearing $80,000 is not just about beating a psychological round number; it requires reclaiming critical trend-defining lines.
The 200-Day Barrier: Currently, the 200-day moving average sits like a ceiling just above the market at $82,300. Bitcoin hasn't logged a definitive daily close above this line for several months.
Institutional Order Blocks: The confluence of the Double Bottom neckline at $80,000 and the 200-day MA at $82,300 has turned the entire $80k–$82k region into a heavy institutional supply zone. A daily and weekly close above this zone converts macro resistance into an ironclad floor, opening the pathway toward $84,910 and the psychological $100,000 target.
The Tactical Playbook
For professional discretionary desks, execution requires confirming the structural change:
The Aggressive Long Entry: Look for an intraday liquidity sweep of the minor support shelf around $75,000, followed by an immediate displacement upward on the lower timeframes (Market Structure Shift).
The Conservative Long Entry: Wait for a confirmed Weekly Close above the $80,000 neckline, treating the subsequent retest of $80,000 as a high-probability institutional buy zone.
Are you bidding the consolidation floor, or are you waiting for the $80,000 neckline to crack? When the weekly double bottom triggers, there won't be time to hesitate.
#BinanceSquare #TechnicalAnalysis #BitcoinDoubleBottom #BTC80K #crypto $BTC
