
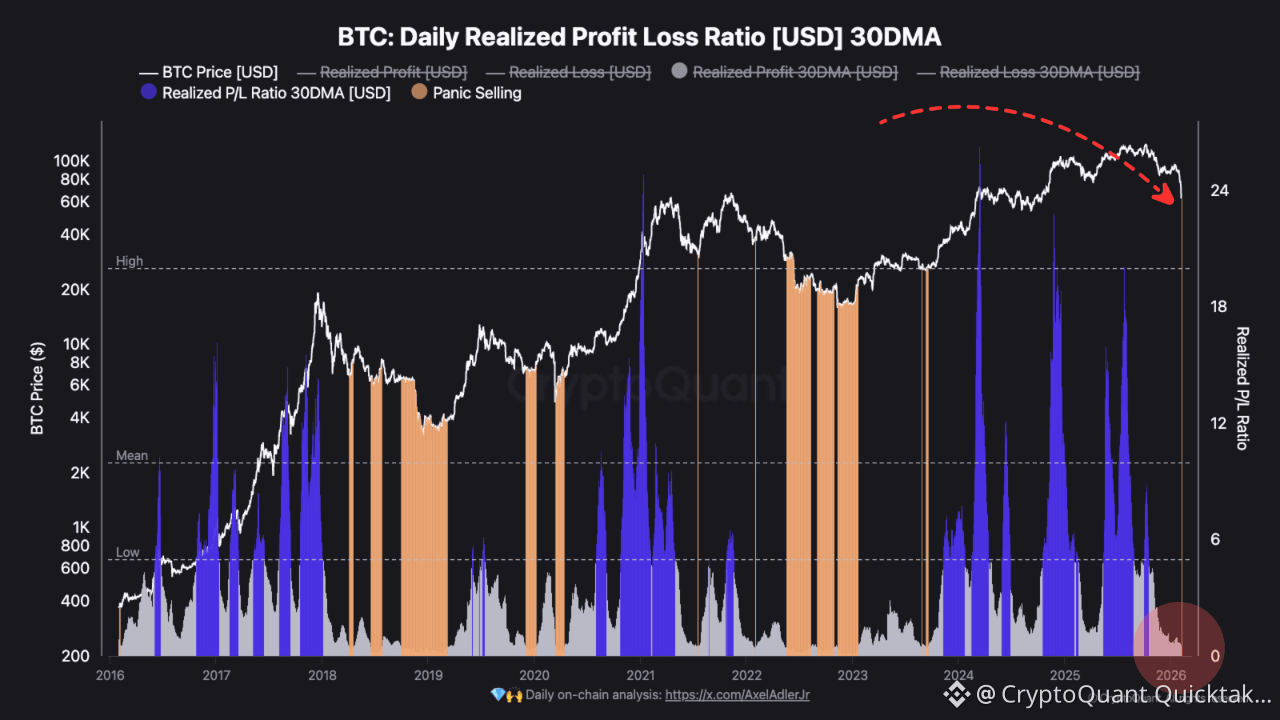
The Daily Realized P/L Ratio just dropped into the "Low" zone with Panic Selling markers active. This isn't just "price went down" — this is the market's economic fingerprint showing forced capitulation.
📊 What This Measures
The P/L Ratio captures economic behavior price alone cannot: when coins move on-chain, are holders realizing profit or loss? Low readings mean loss-realizers dominate — margin calls, forced liquidations, emotional exits.
The Panic Selling layer confirms velocity: not gradual selling, but sudden forced exits matching historical capitulation patterns.
The distinction matters: organic selling can persist. Forced selling exhausts itself.
🔍 Historical Precedent
This exact setup — P/L Ratio Low + Panic Selling active — has occurred 4 times since 2016:
→ Dec 2018 ($3,200): 12-month outcome +340%
→ Mar 2020 ($5,000): 12-month outcome +1,100%
→ Jun 2022 ($22,000): NOT final bottom — fell 30% more before recovery
→ Nov 2022 ($16,000): 12-month outcome +170%
Three of four marked actionable bottoms within weeks. One marked the beginning of capitulation, not the end.
📈 The Pattern
When realized losses overwhelm profits and panic selling accelerates, we're witnessing forced capitulation — a condition that historically exhausts itself rather than persists.
⏳ What This Doesn't Guarantee
Precise timing (signal can lead bottom by 0-16 weeks), magnitude of further downside, or duration. This measures exhaustion of sellers, not absence of risk.
Current setup suggests forced selling is occurring. History suggests forced selling exhausts itself.
Written by RugaResearch