
📰 Daily Market Update:
Recent on-chain and institutional flow data is starting to paint a more cautious picture for Bitcoin price action.
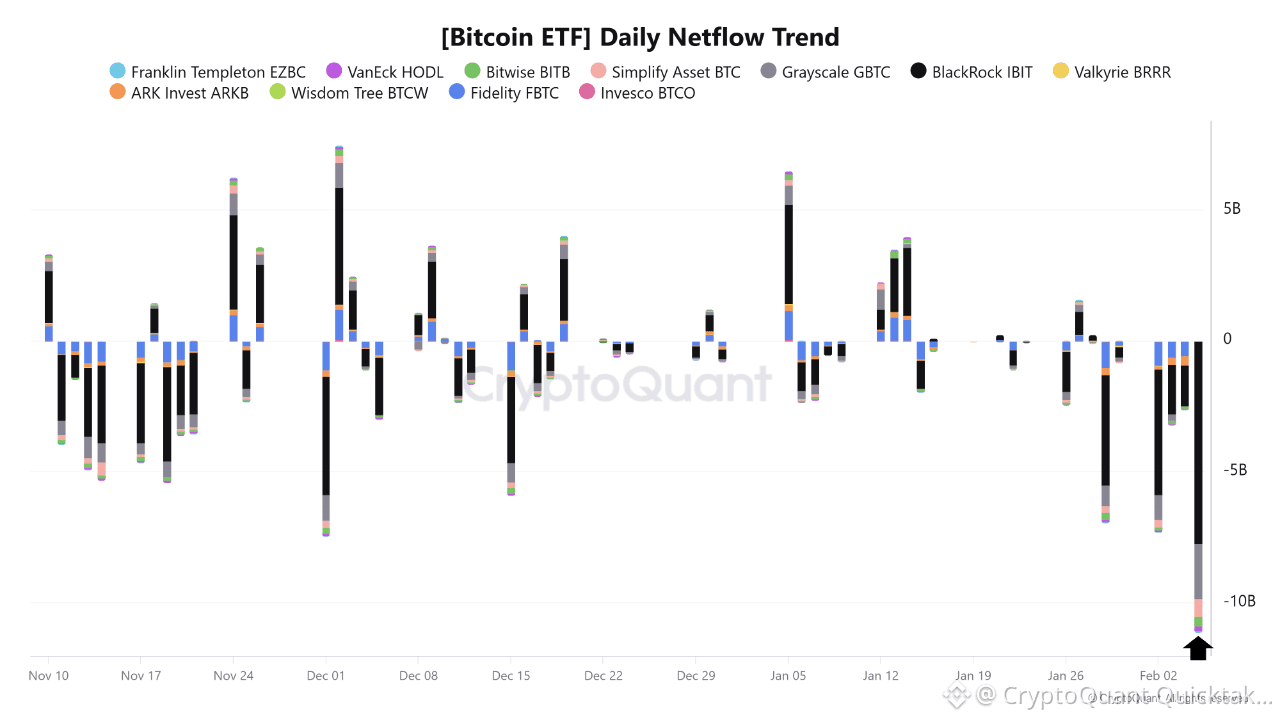
📊 [Bitcoin ETF] Daily Netflow Trend
The chart tracks the daily net value (USD) of Bitcoin flows into spot BTC ETFs.
📈 Positive netflows → actual BTC buying → bullish price pressure
📉 Negative netflows → BTC selling → bearish pressure
🔬 Key Observation
📉 The chart highlights a second major negative outflow in February from BlackRock’s IBIT ETF.
📅 On February 5, IBIT recorded a massive net outflow exceeding $7.7 billion, the largest in this period.
📉 The first negative outflow occurred on February 2, with more than $4.7 billion leaving the fund.
📉 In second place, Grayscale (GBTC) also recorded a negative outflow of over $2.1 billion.
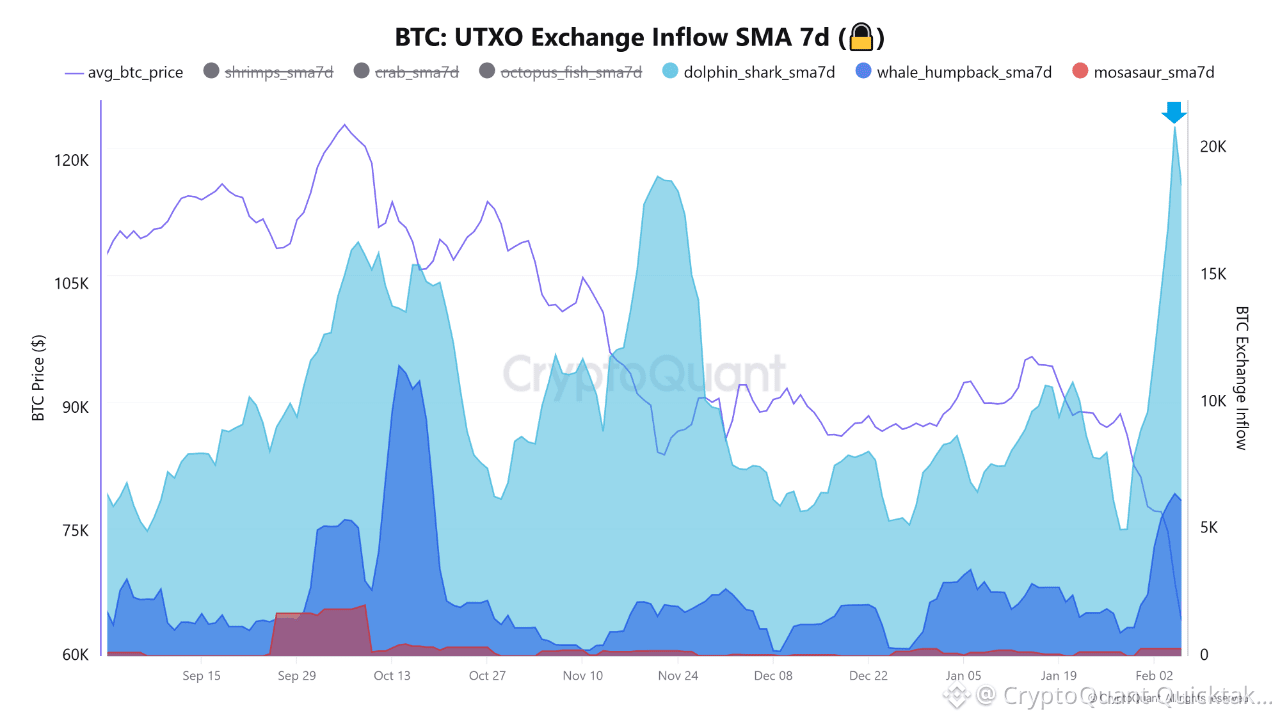
📊 BTC: UTXO Exchange Inflow SMA 7d
The chart breaks down Bitcoin inflows to exchanges based on wallet size categories, offering insight into which group is preparing to sell.
🔬 Key Observation
📈 A sharp spike in the light blue area representing Dolphin / Shark wallets.
📈 On February 5, inflows surged to 20,800 BTC.
📅 In our previous update, we already noted that February 4 saw inflows spike to 14,900 BTC.
📅 This is the first time inflows exceeded 20,800 BTC since October, when BTC was trading above $122,000.
📊 [Binance] Multi-Asset Netflow - $Value
The chart shows the net USD value flows of BTC, ETH, USDT, and USDC moving in and out of Binance, the biggest spot exchange by trading volume.
🔬 Key Observation
📈 On February 5, Bitcoin net inflows on Binance jumped to $727M.
📅 We have not seen similar BTC inflow levels since mid-November.
📉 At the same time, USDT recorded consecutive negative netflows, with the latest outflow reaching approximately –$450M.
🧠 Final Conclusion
⏲️ Historically, positive BTC alongside negative stablecoin flows are often interpreted as risk-off behavior, where market participants reduce crypto exposure.
Written by Amr Taha