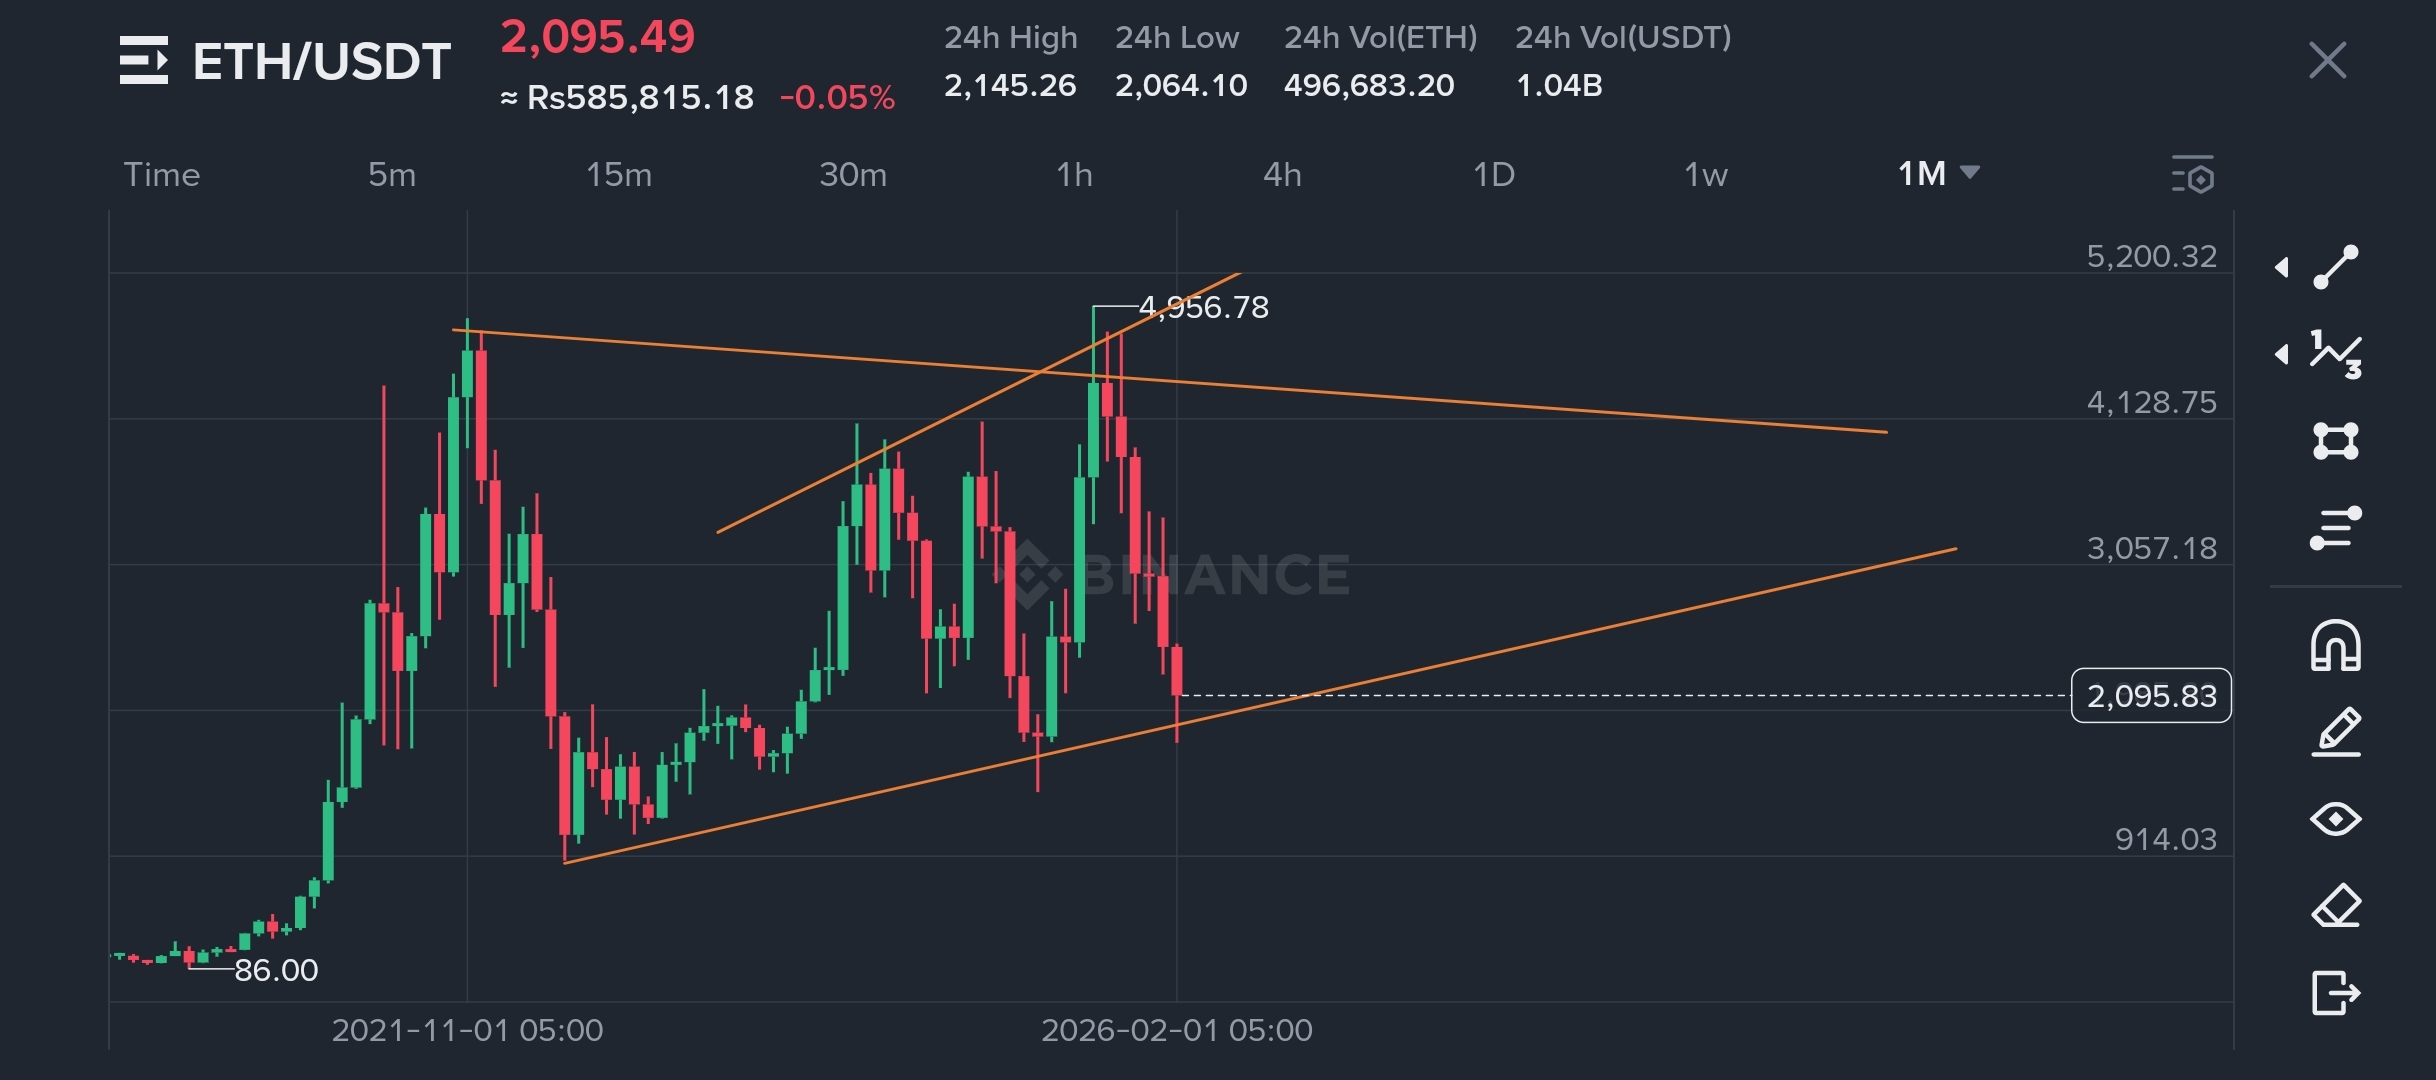
If Ethereum breaks its support levels, the market could go below $1,200 or even $1,000. Currently, Ethereum is trading at a critical level of $2,000.
What's happening right now? (Current Situation)
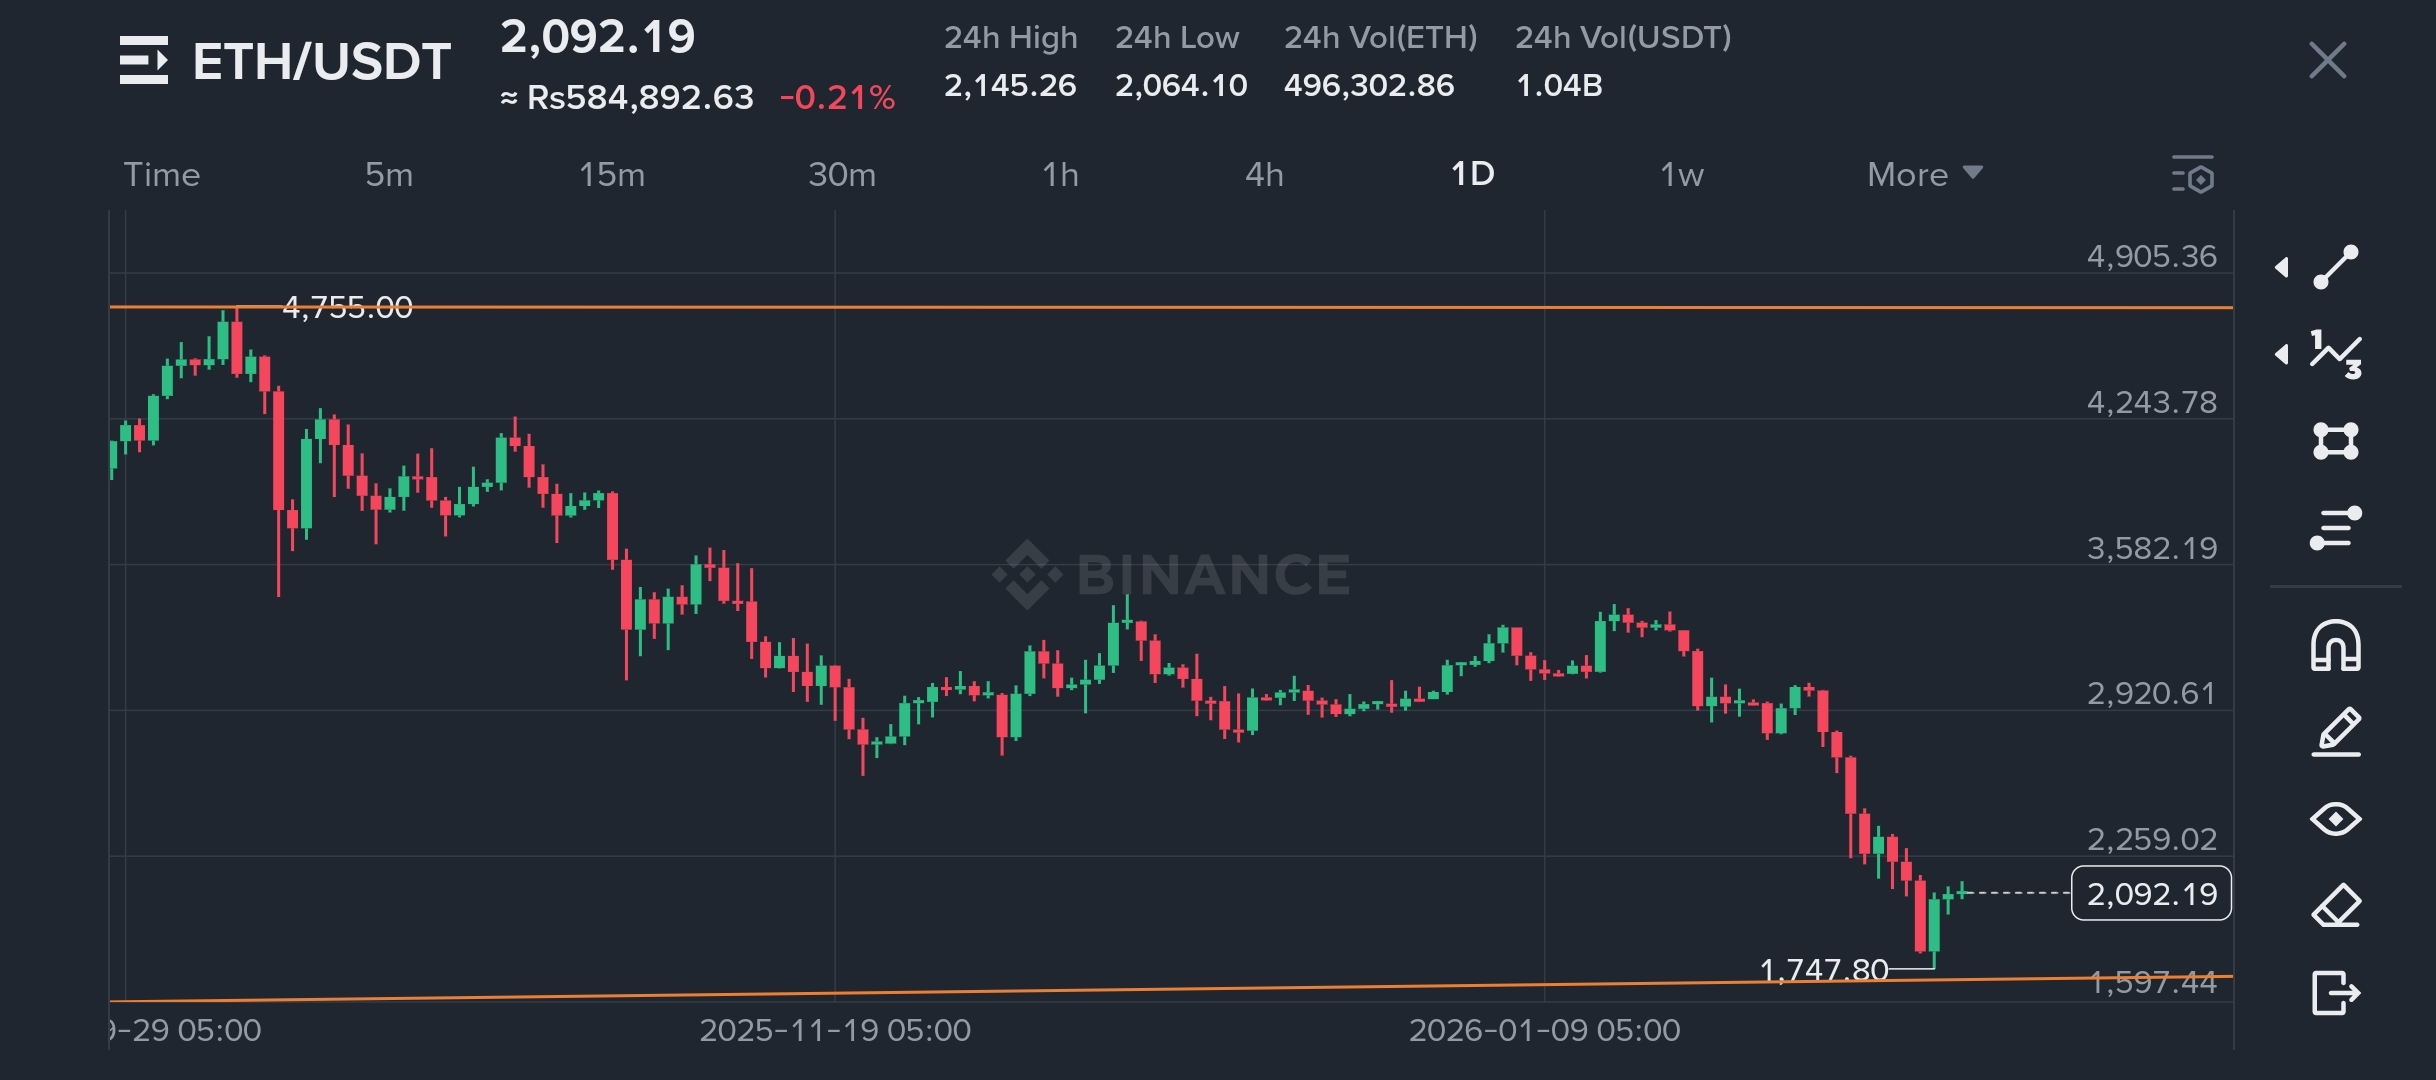
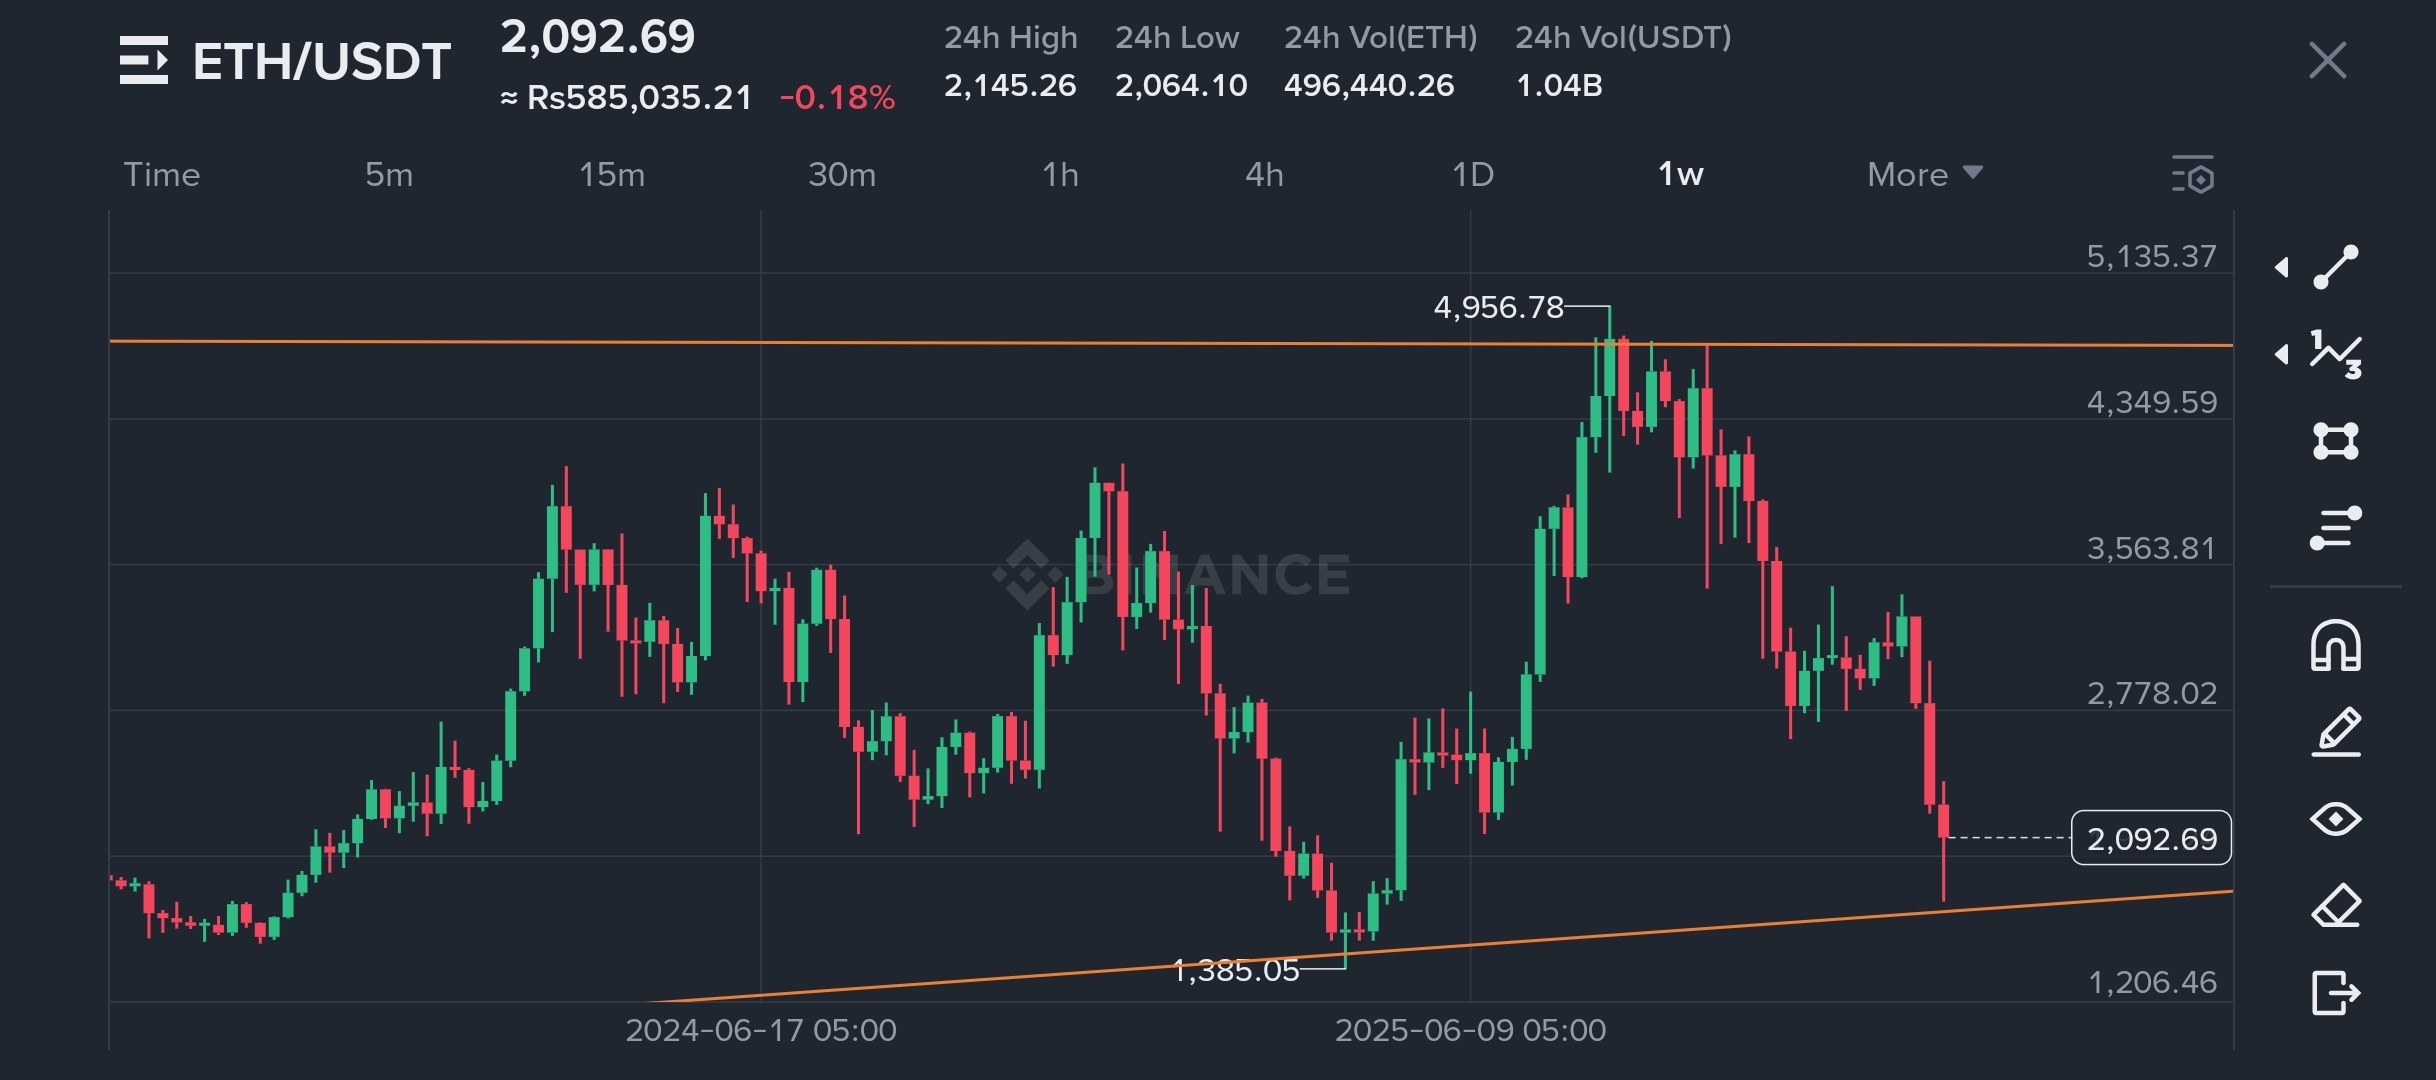
· The price of Ethereum is in a strong downtrend.
· So far, key levels of $2,800** and **$2,100 have been broken.
· The price has made a low of $1,738**, but is now consolidating around **$2,000.
Upcoming Support Levels and Downside Targets (Next Support & Downside Targets)
· First major support: $1,700 - $1,800 zone. This is where a previous bounce occurred.
· Second major support: $1,400 - $1,500 zone. Many analysts consider this the next critical level.
· Third major support: $1,000 - $1,200 zone. This is viewed as a long-term "fire sale" area.
Which way is the Market Going? (Market Sentiment & Catalysts)
· Market Sentiment: Is at "Extreme Fear" level, which often precedes strong moves.
· Technical Structure: Daily charts confirm the downtrend. Price needs to reclaim the $2,100 - $2,200 zone for any chance of a bullish reversal.
· Ethereum Fundamentals (Network Use): Despite the poor price, activity on the Ethereum network (transactions, active addresses) is increasing, which is positive long-term.
Note for Investors: The cryptocurrency market is very volatile. No prediction is entirely accurate. Please conduct your own research and manage risk before trading.
---
In English
If Ethereum breaks its support levels, the market can indeed fall below $1,200 or even $1,000. Currently, Ethereum is trading around the critical $2,000 level.
What is happening right now?
· Ethereum's price is in a strong downtrend.
· Key levels like $2,800** and **$2,100 have already been broken.
· Price has made a low of $1,738** but is now consolidating around **$2,000.
Next Support Levels & Downside Targets
· First major support: The $1,700 - $1,800 zone. This is where a previous bounce occurred.
· Second major support: The $1,400 - $1,500 zone. Several analysts see this as the next critical level.
· Third major support: The $1,000 - $1,200 zone. This is viewed as a long-term "fire sale" area.
Where is the Market Heading? (Sentiment & Catalysts)
· Market Sentiment: Is at "Extreme Fear," which often precedes strong moves.
· Technical Structure: The daily charts confirm the downtrend. Price needs to reclaim the $2,100 - $2,200 zone for any chance of a bullish reversal.
· Ethereum Fundamentals: Despite the poor price, activity on the Ethereum network (transactions, active addresses) is increasing, which is positive long-term.
Note for Investors: The cryptocurrency market is very volatile. No prediction is entirely accurate. Please conduct your own research and manage risk before trading.
Daily, weekly and monthly chart frame...