This is not just another dip. This is a price level that has history.
Bitcoin is currently trading around 67,800 USD, sitting directly on a horizontal demand zone that has already been tested multiple times this month. On the chart you shared, we can clearly see three interactions with the same area. The first touch produced a clean reaction bounce. The second move swept lower toward the 65,000 region before recovering strongly. Now price is back again, pressing against the same band. When a level keeps getting tested, the market is preparing for a bigger move.
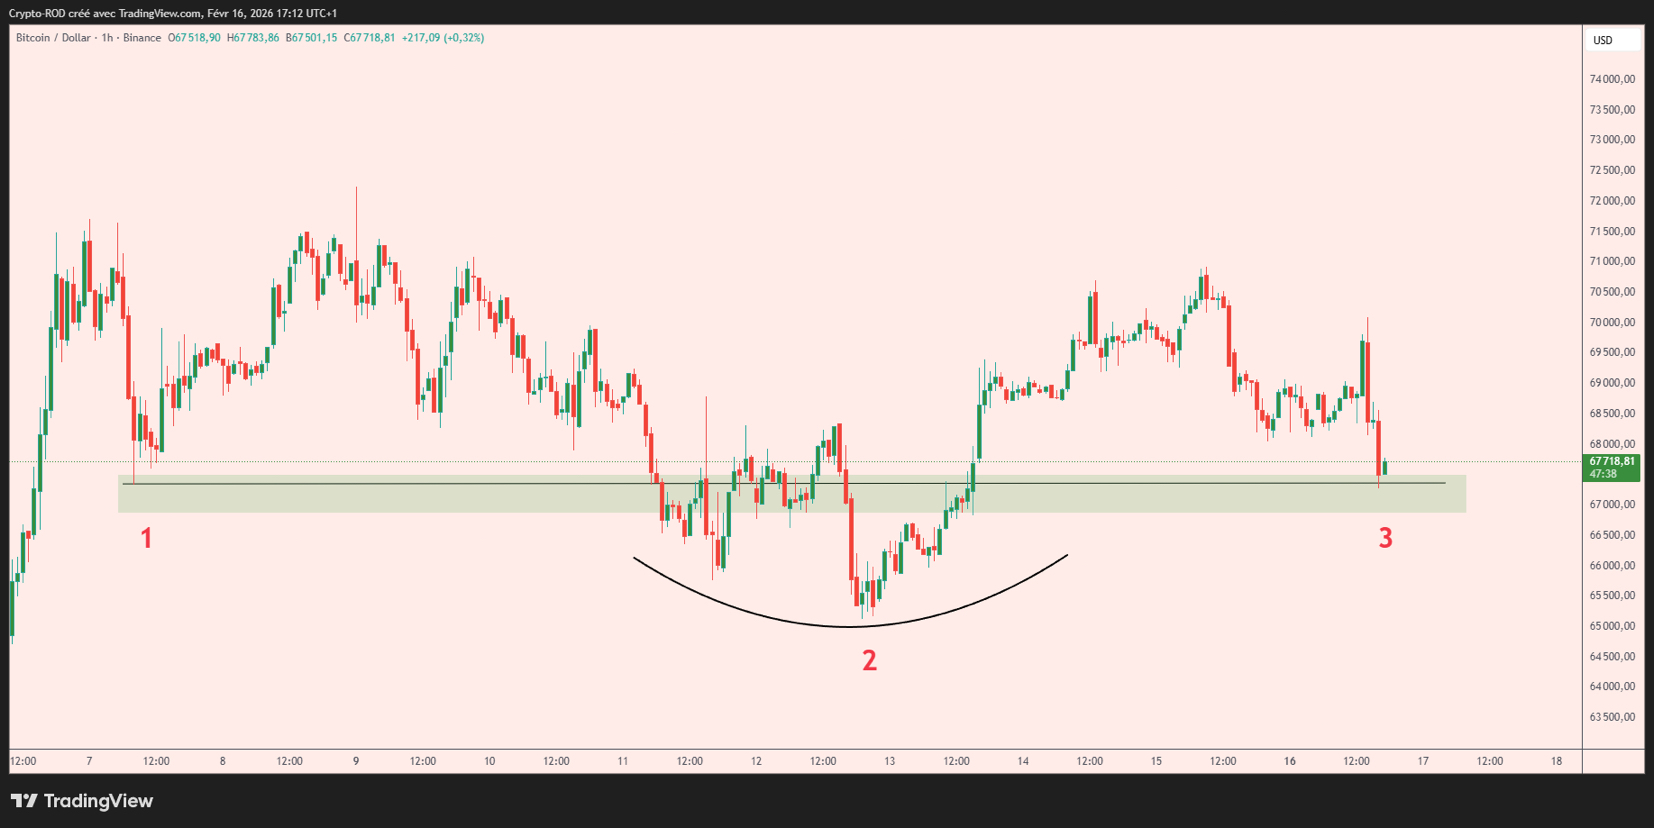
The first reaction showed buyers stepping in around the mid 67K area. That bounce pushed price back toward 70K, but it failed to create a strong higher high. That was the first warning that upside strength was limited. The second drop went deeper, dipping near 65K and clearing liquidity below the range. From there, Bitcoin recovered sharply and climbed back toward 71K. That move showed that real demand existed below the range.
Now the situation is different. Price has returned to the same support near 67K after failing again around the 70K to 71K region. The structure is tightening. When support holds once, it is strong. When it holds twice, it becomes important. When it is tested three times, it becomes fragile unless buyers show clear dominance.
Historically, repeated support tests in Bitcoin often lead to one of two outcomes. Either a strong reclaim follows, trapping short sellers and triggering a squeeze, or the level finally gives way and price moves quickly toward the next liquidity pocket. Back in previous cycles, similar triple tests have led to fast expansions in volatility. The quiet phase usually comes before the larger move.
From a structural perspective, the key question is acceptance. If Bitcoin can reclaim 69,500 to 70,000 with momentum and hold above it, the recent weakness may turn into a squeeze setup. Above 70K, there is visible liquidity resting near recent swing highs. If price accelerates through that area, momentum can shift quickly.
On the other side, if 67K loses strength and we see acceptance below 66,500, the next logical draw sits closer to the 64K to 65K area where previous imbalance was formed. Markets often revisit unfinished zones before choosing a broader direction.
This is not about guessing the bottom. It is about reading behavior. Right now Bitcoin is compressing between resistance near 70K and support near 67K. Compression usually leads to expansion. The third test tells us pressure is building.
The next reaction from this zone will not be small. Watch how price responds around 67K. Fast reclaim signals strength. Slow bleed signals risk.
Bitcoin is not trending strongly right now. It is deciding.
#BTCFellBelow$69,000Again #OpenClawFounderJoinsOpenAI #PEPEBrokeThroughDowntrendLine #MarketRebound #TrumpCanadaTariffsOverturned