2025 was strange in hindsight.
There were setups everywhere. Charts kept moving. Opportunities didn’t really disappear — consistency did. A lot of losses I saw, including my own at times, had very little to do with strategy itself.
Entries came too early.
Momentum got chased.
Patience disappeared exactly when it mattered most.
What helped wasn’t another indicator or prediction model.
It was returning to structure again.
Instead of reacting to every move, I started paying attention to recurring behaviors — the same formations appearing across different markets and timeframes. Patterns don’t predict outcomes, but they do reveal how pressure builds and releases.
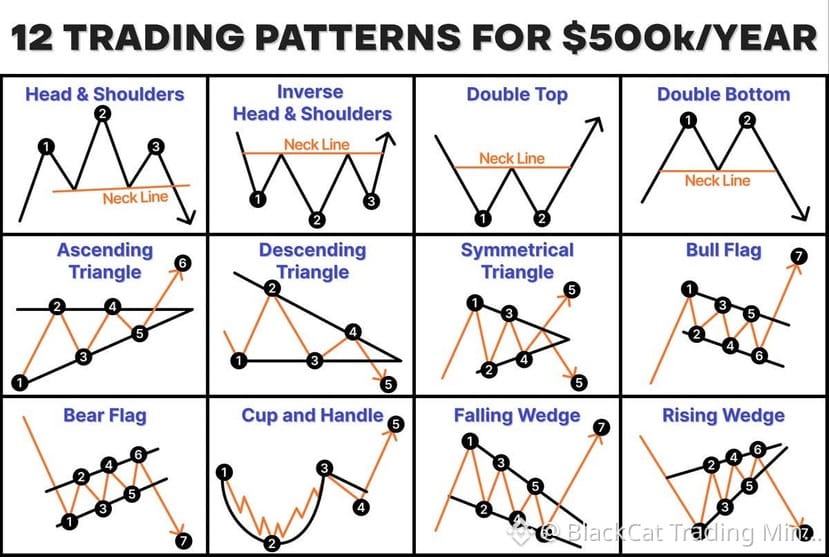
Going into 2026, these were the structures that kept showing up in my decision process.
Head & Shoulders
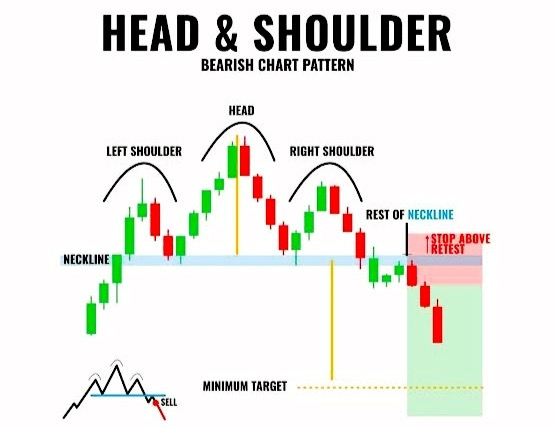
Usually forms late in a trend, when continuation starts feeling forced. The important part isn’t the shape — it’s the inability of price to extend higher before momentum fades.
Inverse Head & Shoulders
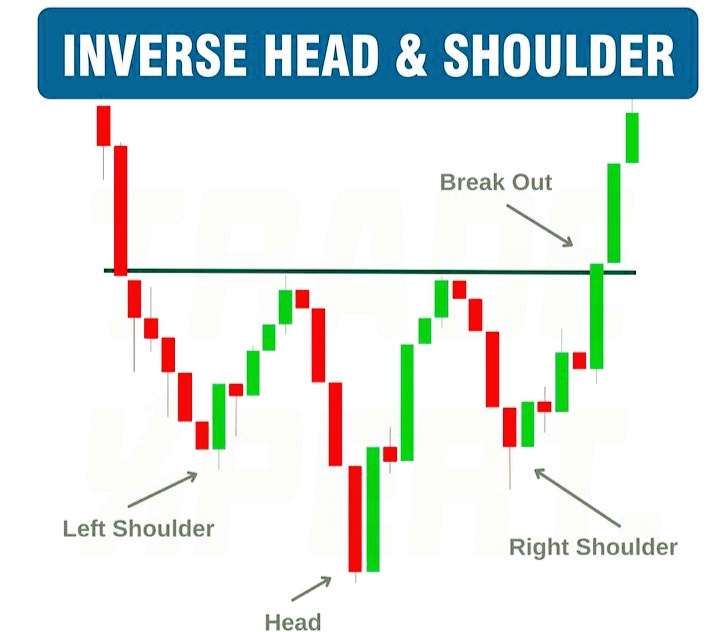
Often appears where selling pressure quietly weakens. Once the neckline is reclaimed, market control tends to shift more gradually than people expect.
Double Top
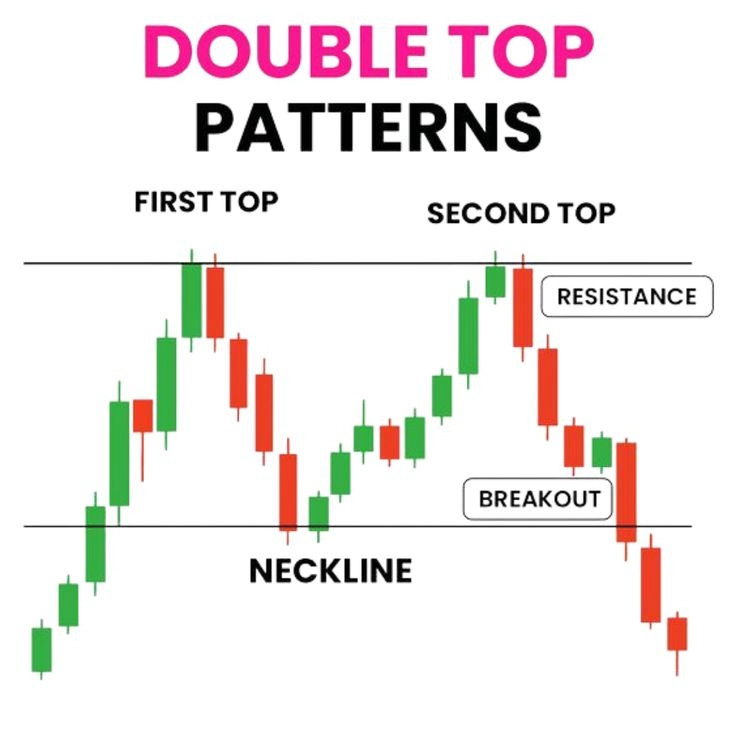
Two rejections at resistance look obvious in hindsight. The real confirmation only arrives when support finally gives way, not at the second peak itself.
Double Bottom
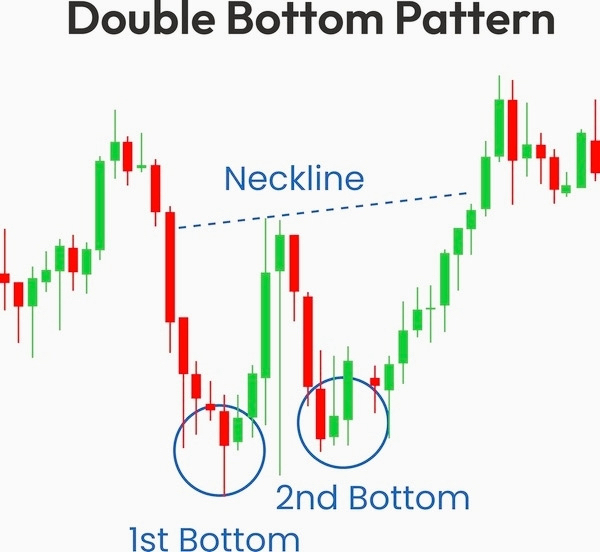
Less about reversal signals and more about repeated absorption. Strength becomes clearer when buyers continue defending the same area.
Ascending Triangle
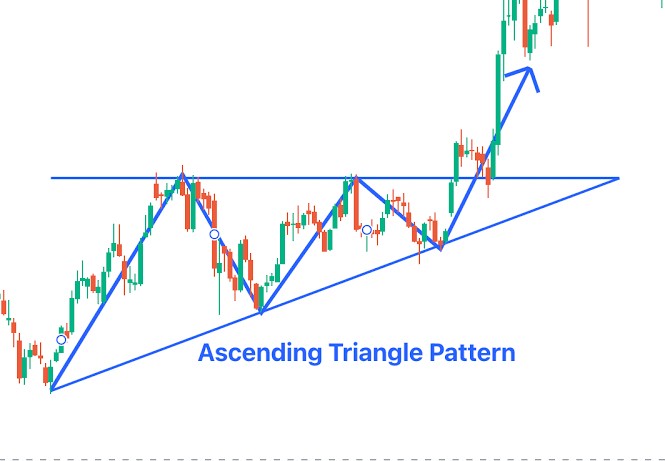
Price compresses beneath resistance while higher lows keep forming underneath. Pressure builds slowly — breakouts tend to follow expansion, not anticipation.
Descending Triangle
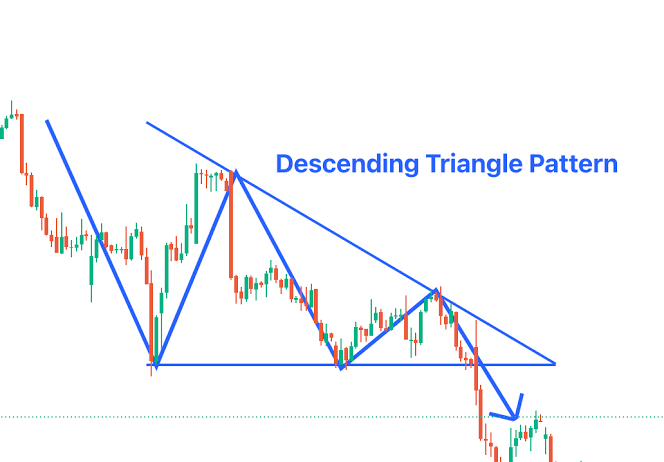
Lower highs begin leaning on support. Demand doesn’t disappear instantly; it erodes over time before breakdown occurs.
Symmetrical Triangle
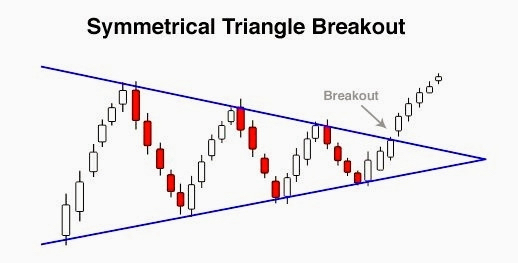
Markets pause here. Direction usually becomes clear only after expansion begins. Guessing early often creates unnecessary trades.
Bull Flag
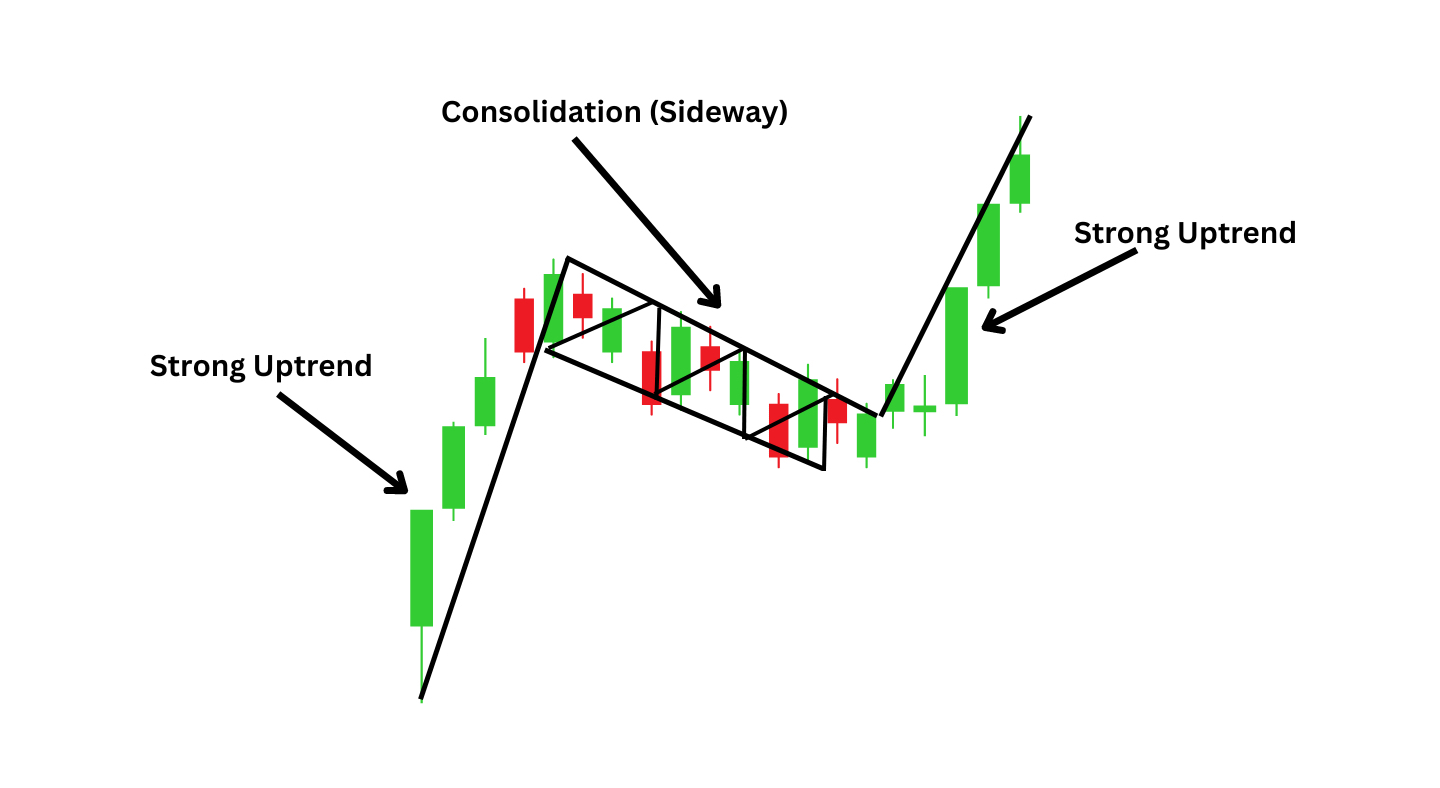
Strong impulse, then controlled cooling-off. Works best when higher timeframe trend still supports continuation.
Bear Flag
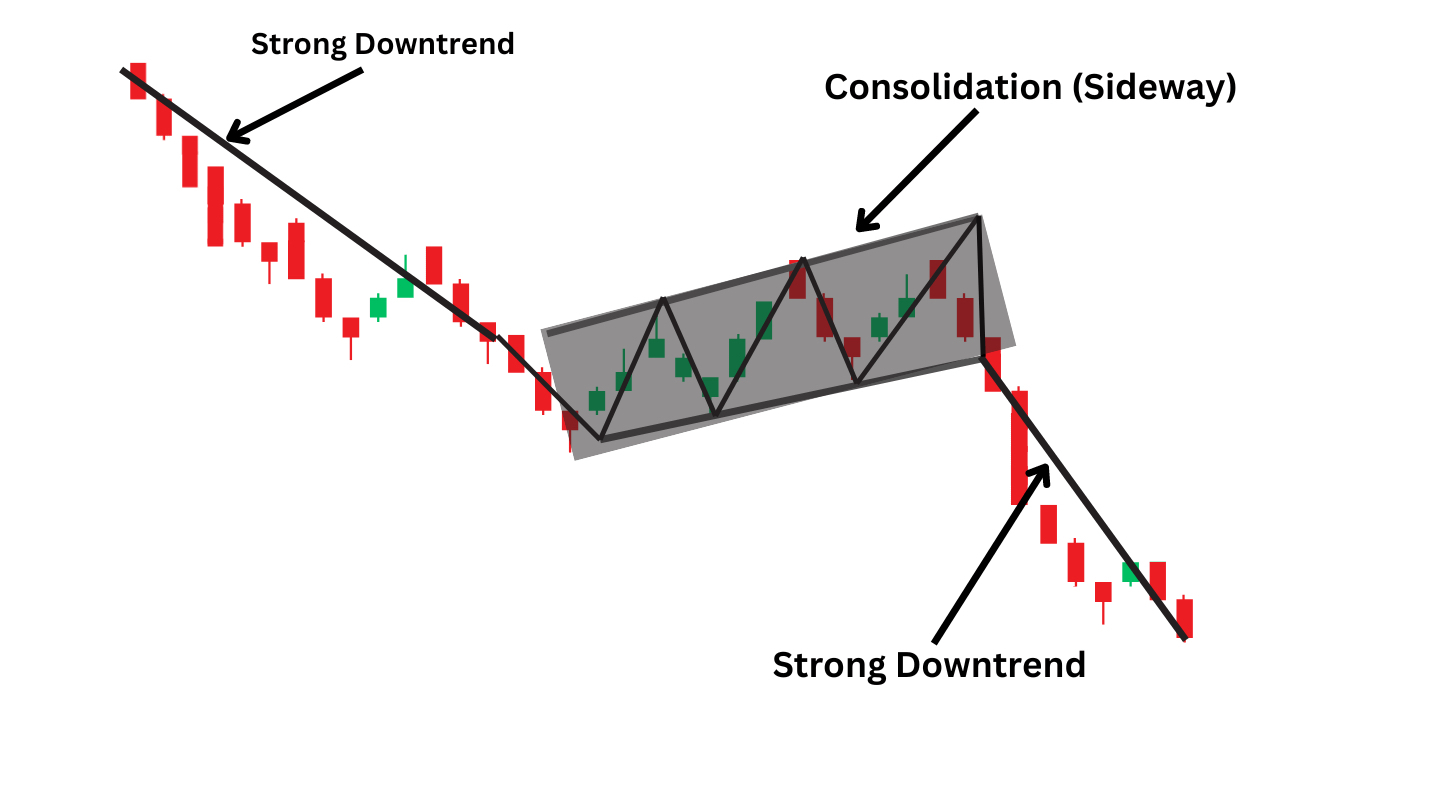
A temporary recovery after sharp downside movement. Momentum looks stable briefly, then continuation often resumes.
Cup & Handle
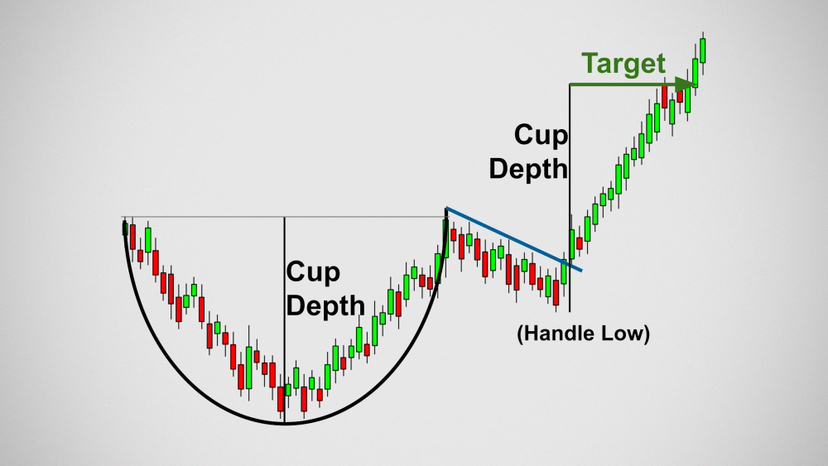
Longer formations where accumulation happens quietly. Breakouts tend to reflect time spent absorbing supply rather than sudden excitement.
Falling Wedge
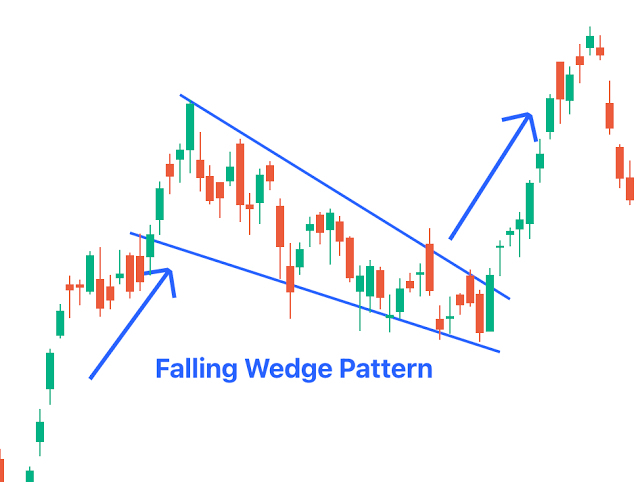
Selling pressure narrows while volatility contracts. Often signals exhaustion more than true bearish continuation.
Rising Wedge
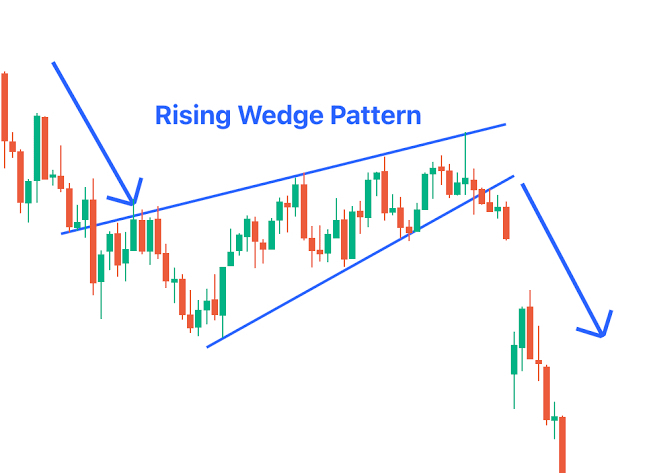
Upward movement continues, but momentum underneath weakens. Rotation frequently follows once buying strength fades.
The Part Most Traders Eventually Realize
Patterns alone don’t create profits.
Context does.
Trend direction matters.
Key reactions around support and resistance matter.
Participation matters.
Risk management matters even more.
No structure works every time. Failures are part of probability.
Consistency usually comes from executing similar decisions repeatedly — not searching for flawless entries.
Study structure.
Control exposure.
Let the market resolve uncertainty on its own.
If you want, next we can look at how these patterns actually translate into execution — entries, invalidation levels, and risk management in live conditions.
#CreatorpadVN $BNB @Binance Vietnam
