
The Fund Flow Ratio becomes far more useful when it is read as a regime-reset indicator, not just as a proxy for “exchange activity is high or low.”
By definition, it measures the share of Bitcoin network activity tied to exchanges. High readings usually reflect a market dominated by trading, repositioning, speculation, and profit realization. But the more interesting signal in this chart is what happens when that activity cools back toward ~0.065.
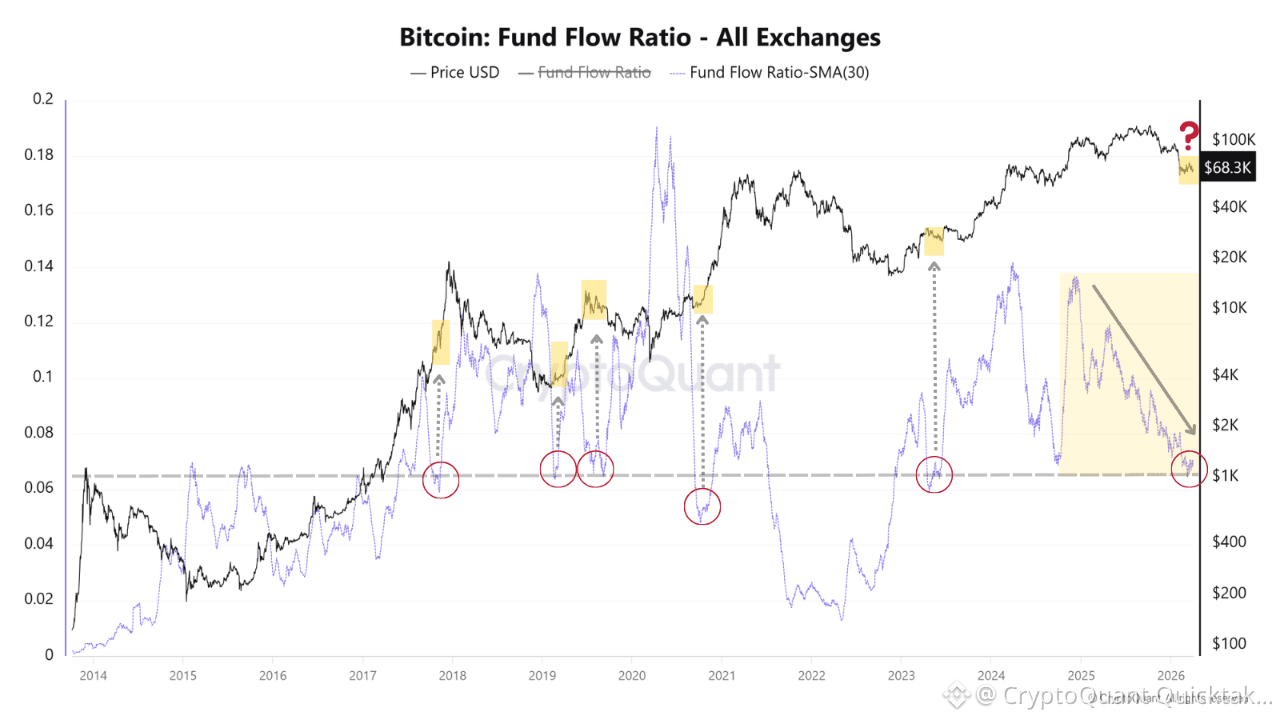
Historically, that zone has repeatedly acted as a structural reset level during broader bullish cycles. I highlighted the following zones: late 2017/early 2018, several points in 2019, late 2020, mid-2023, and now again in 2026.
In each prior case, when the 30d Fund Flow Ratio compressed into that area, BTC was either finishing a corrective phase or moving through a consolidation that later resolved higher. That distinction matters.
A falling Fund Flow Ratio does not automatically mean bearishness. It can mean that speculative churn is being flushed out, coins are moving less aggressively through exchanges, and the market is transitioning from distribution/noise back into tighter supply and cleaner positioning.
This is why the current setup deserves a more precise read. Since the late-2025 peak in Fund Flow, BTC has corrected sharply while the ratio has continued to trend lower, now returning toward the same ~0.065 area that previously marked important reset zones. What this says is that the correction has not been accompanied by a renewed expansion in exchange-relative activity. That weakens the idea of broad panic distribution and instead suggests that the market has been undergoing a participation washout.
BTC may be completing another internal reset inside a larger cycle, with diminished speculative froth and a better base for re-acceleration. If it breaks materially below prior support, then this time the contraction would look less like a healthy reset and more like a deeper deterioration in market engagement.
Written by MorenoDV_