
📊 $BTR
🔍 1. Market Overview
Pair: BTR/USDT (Perpetual)
Current Price: ~0.04083
24H High / Low: 0.04537 / 0.03628
Trend Context: Extreme volatility followed by long consolidation
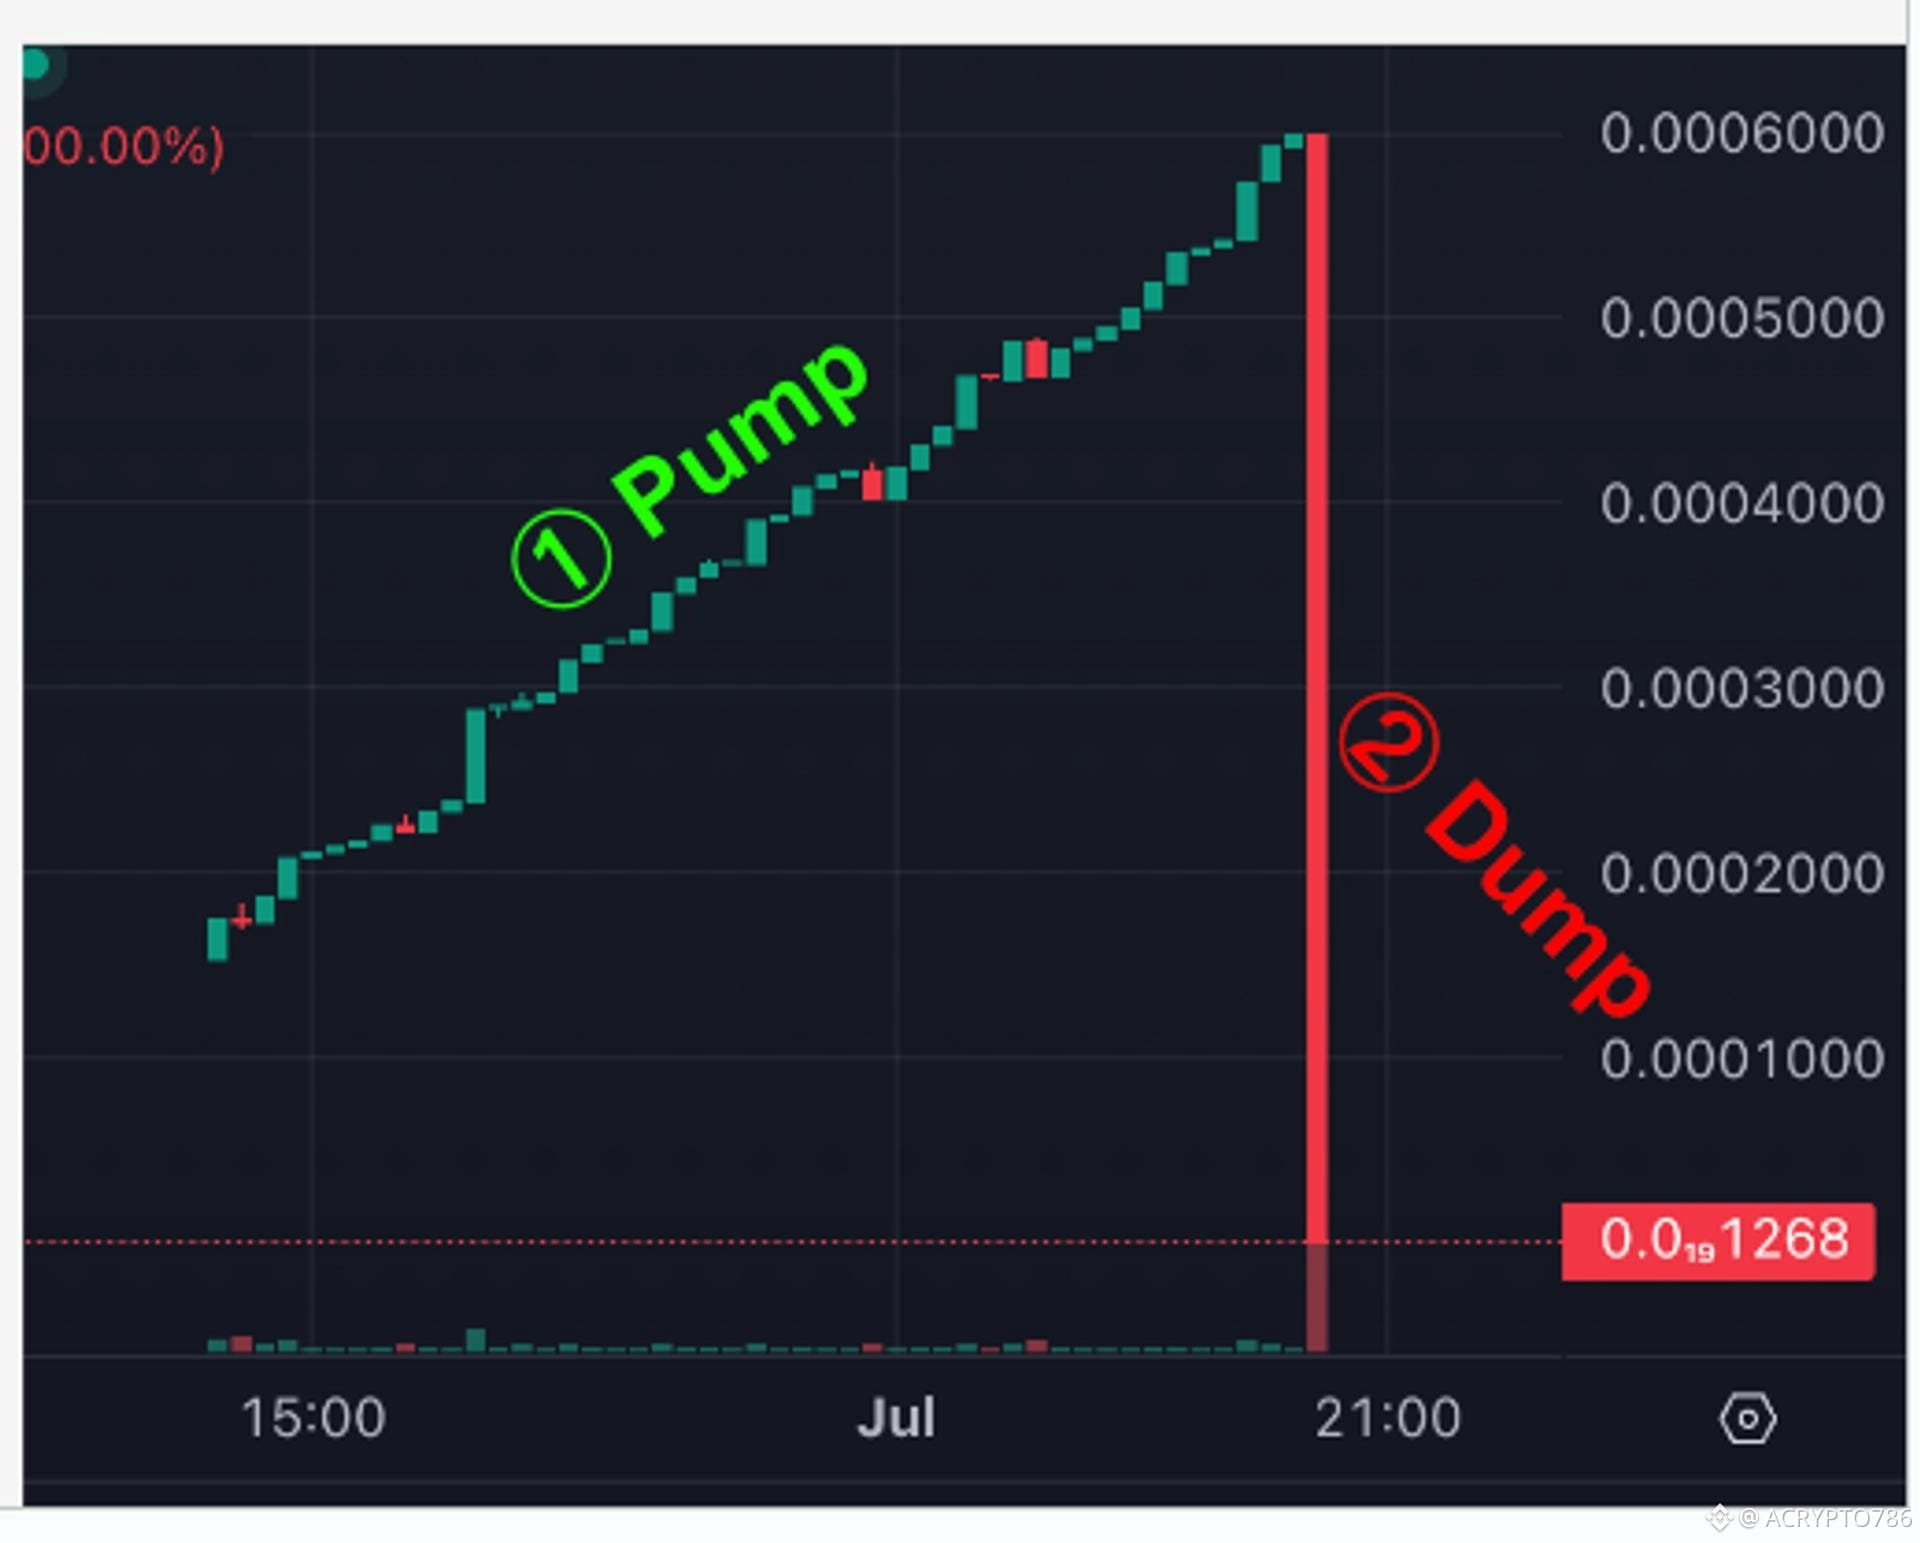
👉 The chart clearly shows a massive pump followed by a sharp dump, which is typical of low-cap or hype-driven tokens.
📉 2. Price Action Breakdown (Step-by-Step)
🟢 Phase 1: Strong Pump
Price surged aggressively up to ~0.20204
Large green candles indicate strong buying pressure
Likely caused by:
Hype / news / listing
Whale accumulation
🔴 Phase 2: Sharp Dump
Huge red candle wipes out gains
Indicates:
Profit-taking
Liquidity grab / bull trap
Retail traders likely got trapped at the top
⚪ Phase 3: Accumulation Zone
Price stabilized around 0.024 – 0.030
Small candles = low volatility
Market behavior:
Smart money accumulation
Weak hands exiting
🟢 Phase 4: Recovery Attempt
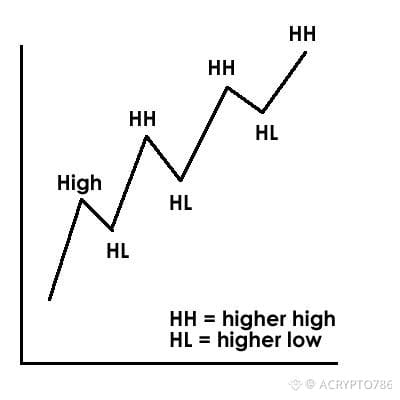
Gradual upward movement
Higher lows forming
Suggests:
Early bullish structure
Possible trend reversal forming
📊 3. Moving Averages Analysis
MA(7): ~0.03325 → Short-term trend turning bullish
MA(25): ~0.02974 → Mid-term support
MA(99): ~0.10267 → Strong resistance above
📌 Key Insight:
Price is currently above short-term MA
But still far below long-term MA → overall trend still weak
📦 4. Volume Analysis
Initial pump had massive volume spike
Dump also had high volume → panic selling
Current phase:
Low volume = accumulation
Slight increase = early interest returning
📌 Interpretation:
Volume confirms trend exhaustion + consolidation
A new spike could trigger next move
🧠 5. Key Support & Resistance
🔽 Support Zones:
0.02461 → Strong base
0.030 → Minor support
🔼 Resistance Zones:
0.045 → Immediate resistance
0.09 → Major resistance (near MA99)
0.20 → Previous top (long-term)
⚡ 6. Trading Signals
✅ Bullish Signals:
Higher lows forming
Price above MA(7)
Volume slowly increasing
❌ Bearish Signals:
Still far below MA(99)
Weak overall trend
Previous strong rejection zone overhead
📈 7. Possible Scenarios
🚀 Bullish Case:
Break above 0.045
Volume surge confirmation
Target zones:
0.06 → 0.09
📉 Bearish Case:
Lose support at 0.030
Retest 0.024
Possible new lows if volume increases on selling
🧾 8. Final Conclusion
BTRUSDT is currently in a post-dump recovery phase. The market shows early signs of strength, but confirmation is still needed.
✔️ Short-term: Slightly bullish
❗ Mid/Long-term: Still weak
👉 Best strategy:
Wait for breakout confirmation
Avoid chasing pumps
Watch volume + resistance levels closely
🔥 Pro Tip
This type of chart is classic:
Pump → Dump → Accumulation → Breakout (if strong)
Smart traders focus on accumulation zones, not hype spikes.
📢
#CryptoAnalysis #BTRUSDT #TradingSignals #VolumeAnalysis #Binance #Altcoins #TechnicalAnalysis