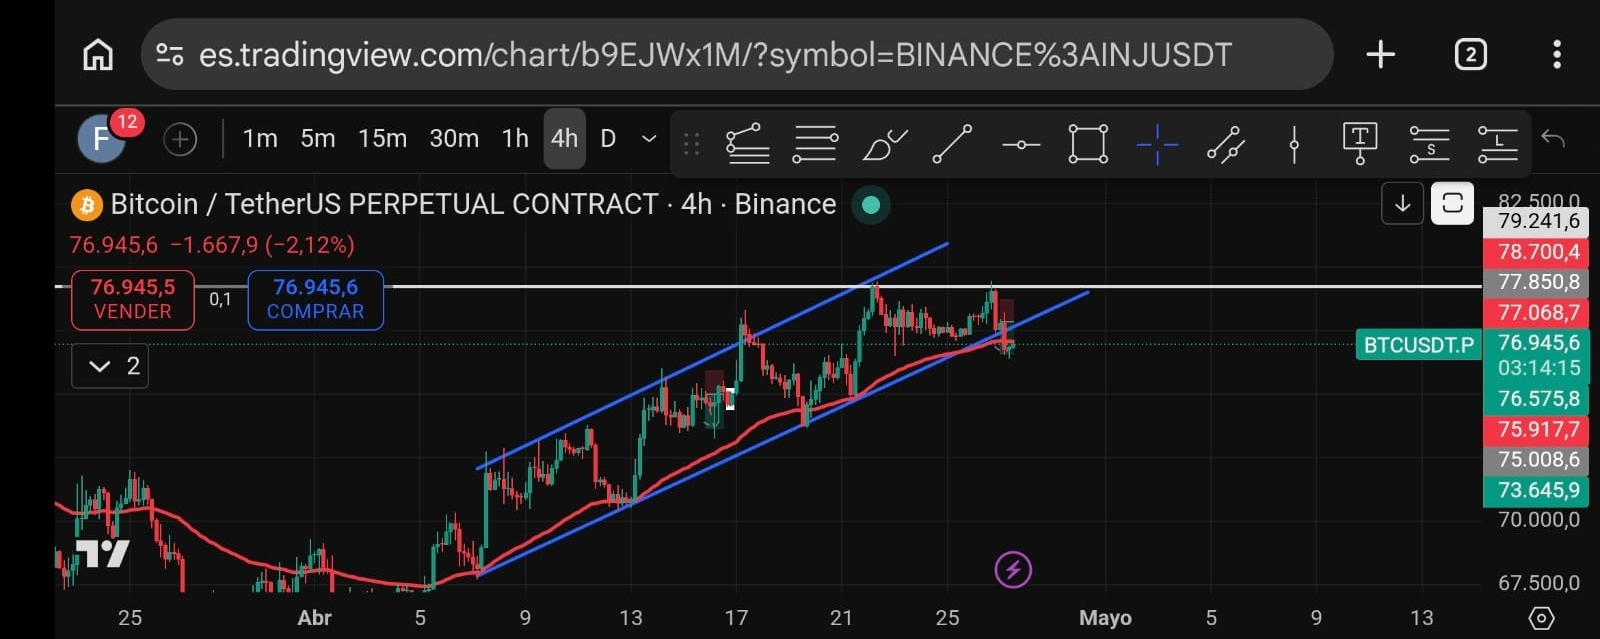
I’m currently analyzing the BTC structure on the 1H, 4H, and daily timeframes, and there’s an interesting point worth discussing.
🔍 Technical context:
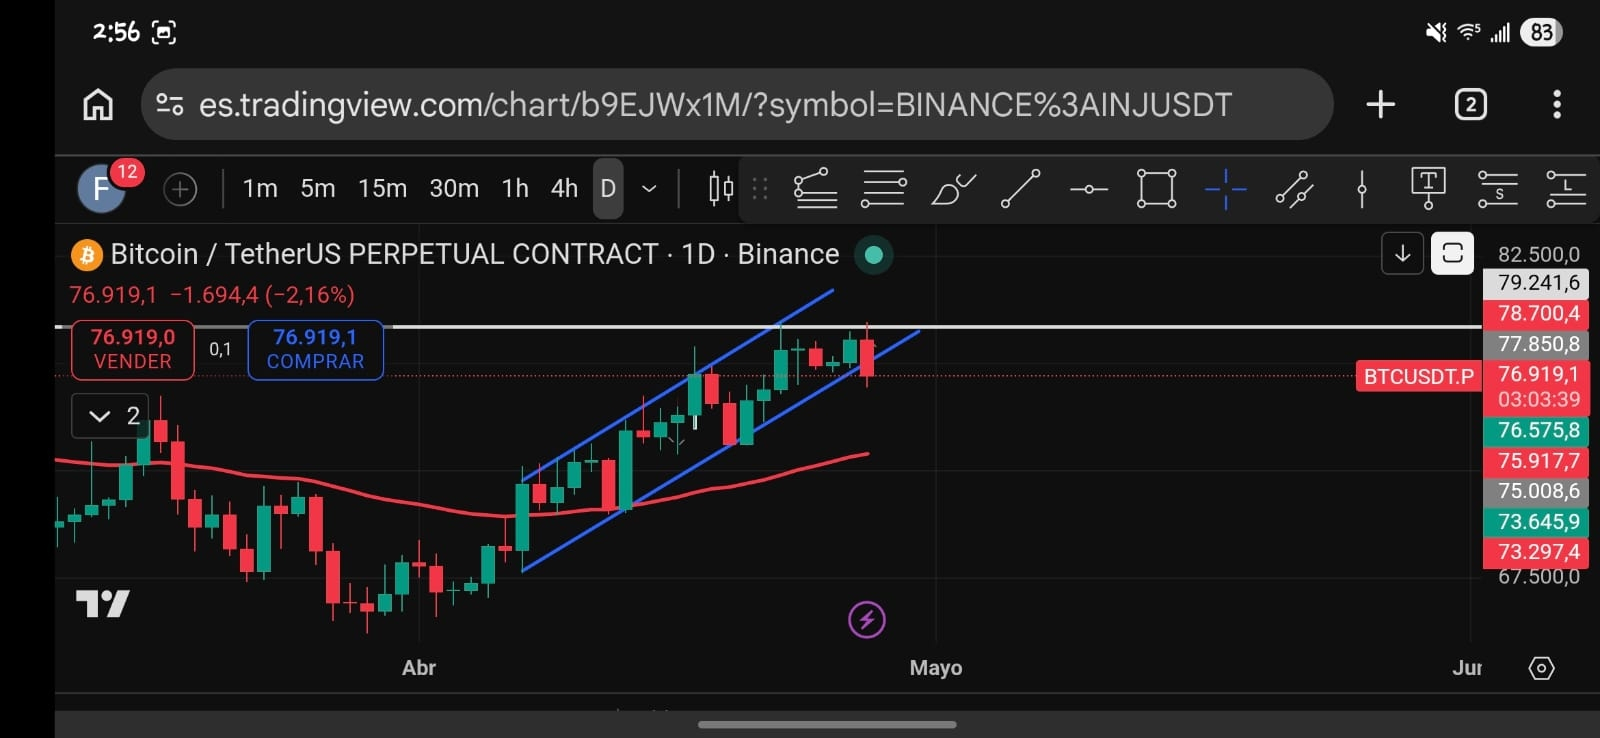
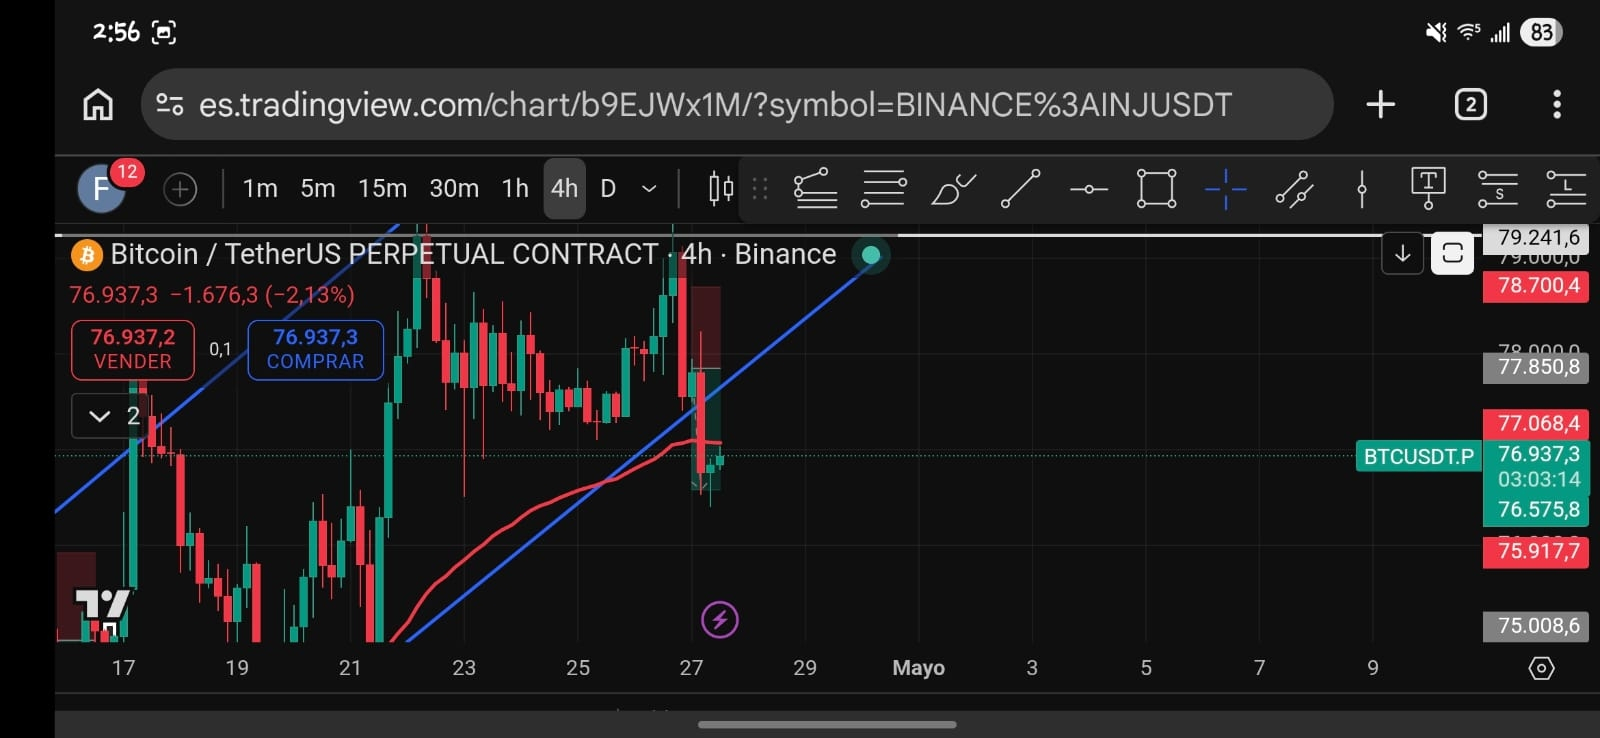
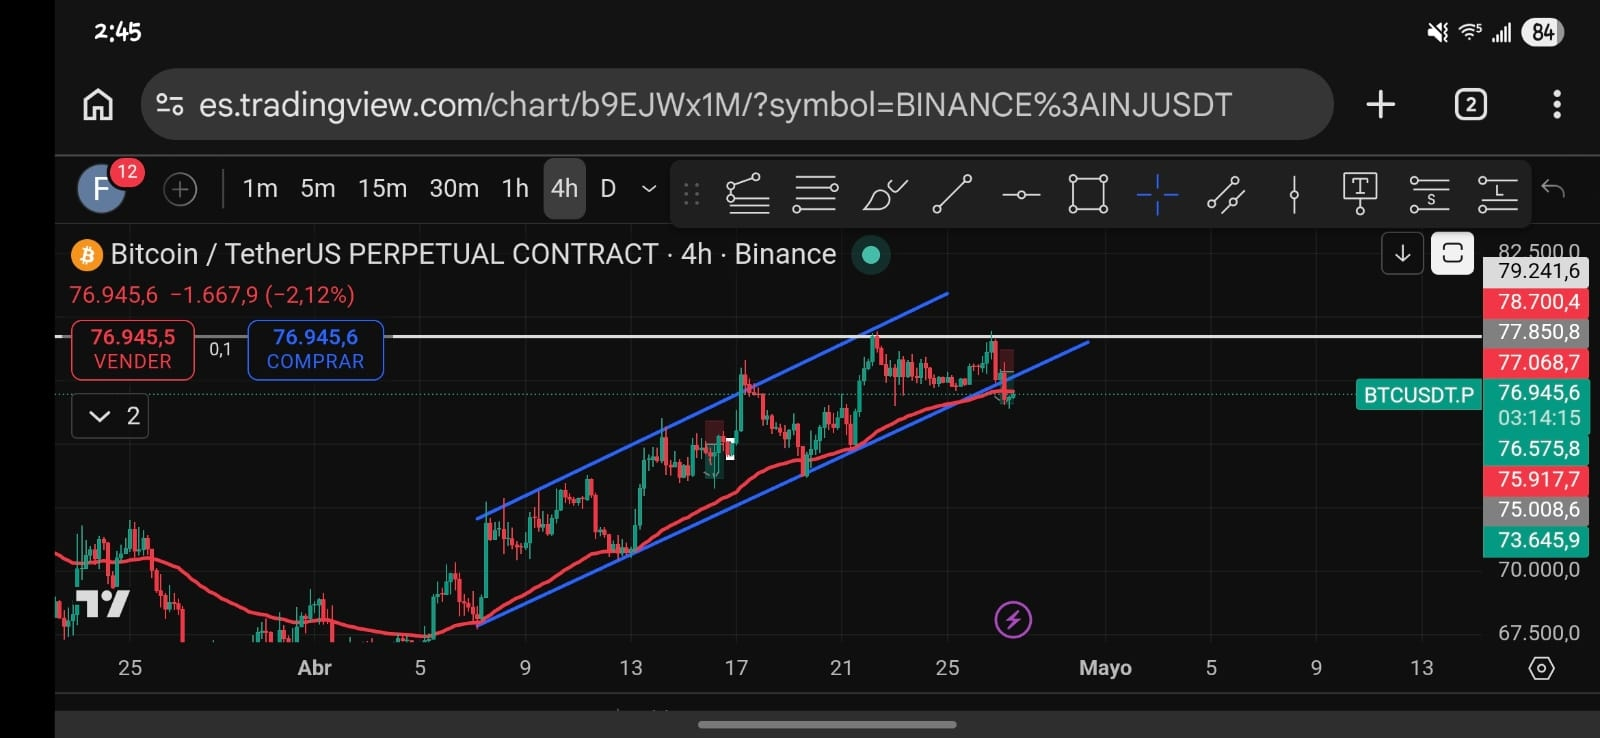
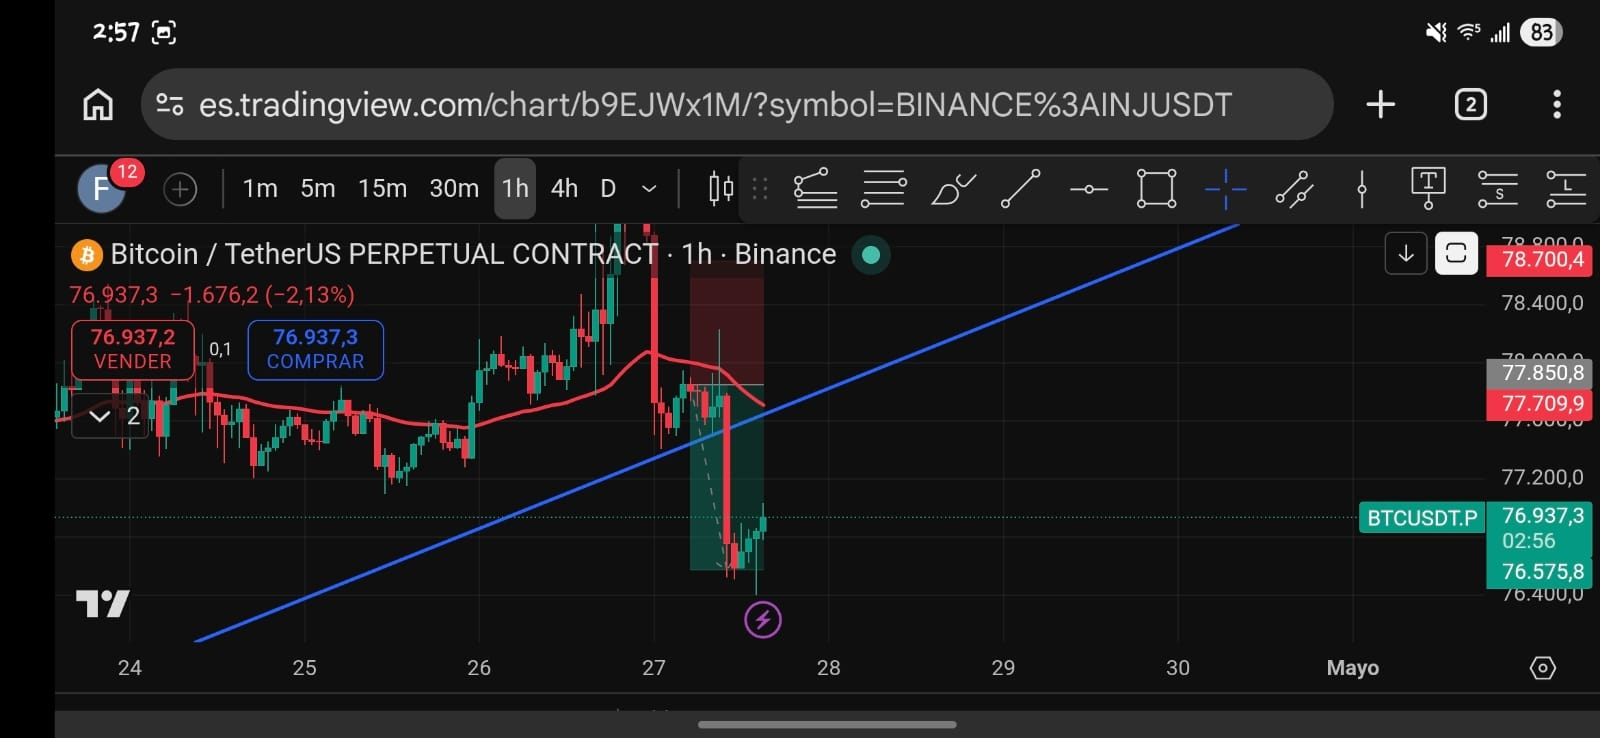
The price had been respecting a pretty clean bullish channel. However, recently there’s been a break of the channel across all three timeframes (1H, 4H, and 1D), which at first glance could be interpreted as a trend reversal.
On the daily chart, the break occurred with a relatively strong bearish candlestick, although full confirmation is still pending with the complete close. In 4H, the breakout was clear, followed by a pullback to the 50 EMA. In 1H, there’s an impulsive drop followed by a slow bounce.
⚠️ Key interpretation:
Even though the breakout is present on multiple timeframes, the current retracement shows weakness (slow movement, small candlesticks). This suggests it could be a pullback before a bearish continuation, rather than an immediate shift to a bullish trend.
📉 Possible scenario:
- Initial bearish momentum
- Pullback to the broken zone (channel / EMA)
- Rejection at resistance
- Continuation downward
❗ But watch out:
Not every breakout is legit. To confirm it, I’d look for:
- Clear rejection on the retest
- Inability to reclaim the channel
- Increased volume on bearish moves
💬 Question for the community:
Do you consider this breakout confirmed, or do you think it could be a false breakout (liquidity trap)?
I’m open to hearing different viewpoints 👇
#BinanceLaunchesGoldvs.BTCTradingCompetition $BTC