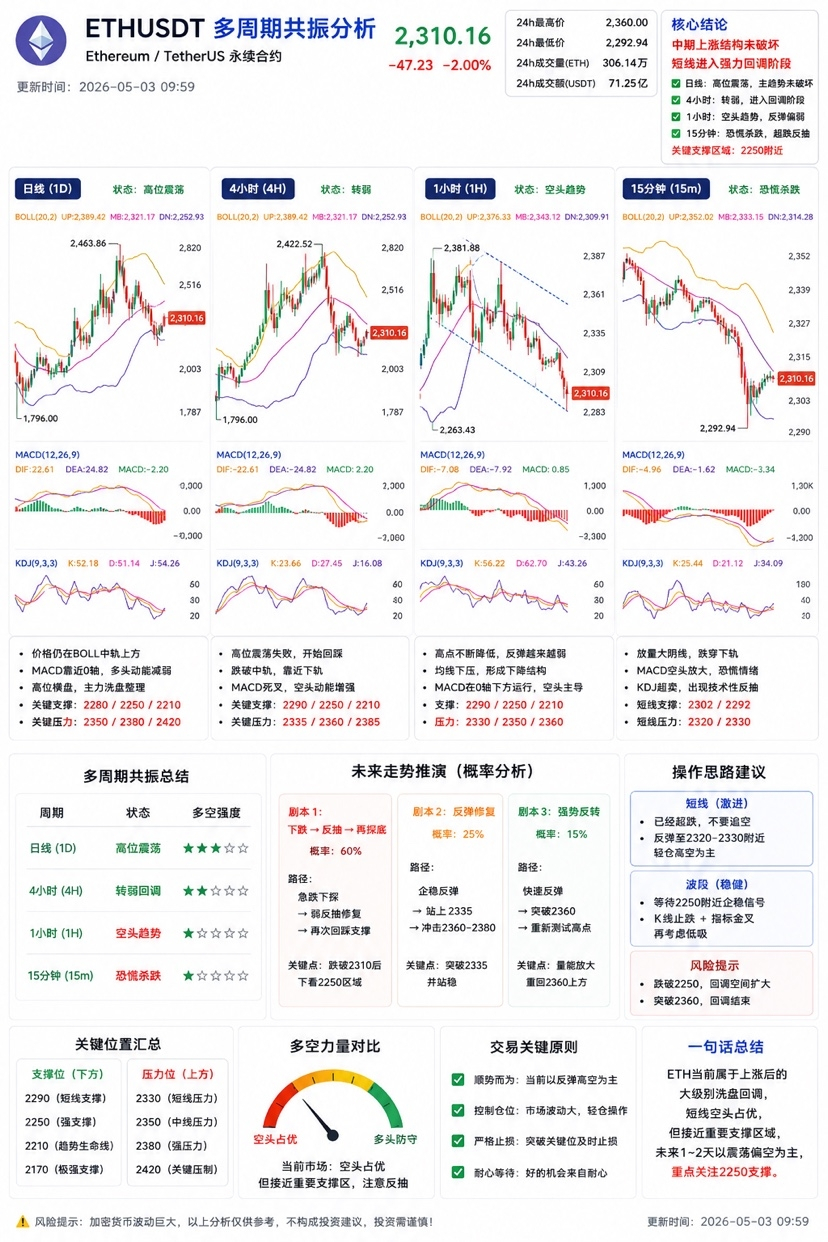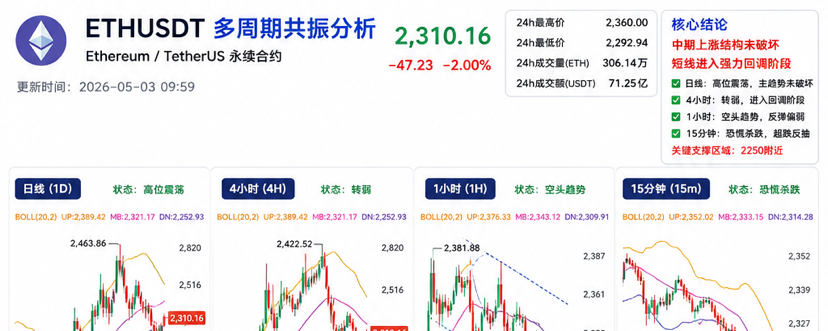
ETHUSDT multi-timeframe resonance analysis
Combining with what you sent:
Daily
4-hour
1-hour
15-minute
The current state of ETH is very clear:
"Medium-term bullish structure not completely broken, but short-term entering a strong correction phase."
To put it simply:
the larger timeframe isn't fully bearish yet
but the smaller timeframe is clearly dominated by bears
Currently belongs to:
The deep washout phase after the pump.
1. Daily level (big picture)
The daily chart is still:
High-level consolidation with a bullish bias.
Although there was a dip today,
But overall, the daily trend hasn't been broken.
Key signals on the daily chart
1) Price is still above the middle band of the BOLL
Explanation:
The main trend hasn't completely turned bearish.
Currently, the daily looks more like:
High-level sideways.
Bullish consolidation.
Main force washout.
And not a crash.
2) MACD.
Daily MACD:
Still near the zero line.
Bearish bars aren't large.
Explanation:
Daily bearish isn't strong.
Currently belongs to:
"Recovery period after increase."
3) Daily key level.
Core support:
2280
2250
2210
Among them:
2250 is the mid-term lifeline.
Do not break:
ETH still has a chance to push higher.
Break below:
The daily will enter a real adjustment.
Daily pressure:
2350
2380
2420
2. 4-hour level (current core).
Currently on the 4-hour chart:
"Weakening phase."
This is the currently most critical cycle.
4-hour structure.
Before:
ETH moved from 2218 to 2422.
Huge upward movement.
Now:
High-level consolidation failed.
Starting to retrace.
Belongs to:
The pullback after the first major rise.
4-hour BOLL.
Now:
Has dropped below the mid-line.
Close to the lower track.
The mid-line is starting to curve down.
Explanation:
Mid-term trend is turning bearish.
4-hour MACD.
Characteristics:
Has crossed into a dead cross.
Red bars turning green.
Bearish momentum strengthening.
This is:
Typical retracement structure.
4-hour key levels.
Support:
2290
2250
2210
Pressure:
2335
2360
2385
3. 1-hour level (bearish dominant).
The 1-hour is clearly leaning bearish.
Current structure.
You can see:
High points continuously lowering.
Rebounds getting weaker.
Moving averages starting to press down.
This is:
Standard descending structure.
MACD.
Current:
Below the zero line.
Bearish bars continue to expand.
Explanation:
Bearish rhythm isn't over yet.
KDJ.
Although already at lower levels,
But:
Weak market conditions will continue to dull the lows.
So:
Doesn't mean a reversal is imminent.
4. 15-minute level (panic selling).
15-minute has already shown:
"Accelerated drop."
Current characteristics.
In your chart:
A large bearish candle has appeared.
Dropped below the lower track.
MACD rapidly expanding.
KDJ is oversold.
This belongs to:
Short-term panic selling is being released.
What stage are we currently in?
Currently belongs to:
First phase:
Bearish release.
Second phase:
Oversold pullback.
Third phase (key):
Watch the pullback strength.
Future probable movement.
Most likely to move:
Scenario 1 (most probable).
"Downtrend → Weak rebound → Re-test the bottom."
That is:
Sharp drop.
Technical pullback.
Revisit to confirm support.
This is the most standard movement.
Key price level.
Strong support zone:
First support:
2290~2300
Second support:
2250
Third support:
2210
Pressure zone:
First resistance:
2330~2335
Second resistance:
2360
Third resistance:
2380~2420
Trading thoughts.
Short-term.
Now isn't suitable to chase shorts.
Because:
Already showing oversold.
Easier to:
First a pullback, then decide the direction.
More reasonable pace.
Aggressive:
Wait for a bounce to:
2330~2350
Observe if it weakens further.
Stable:
Waiting:
Stabilizing near 2250.
Consider low buying again.
The most important sentence.
ETH is not crashing right now.
But it's:
"Major level washout after increase."
But short-term bearish has taken over the rhythm.
So:
In the next 1~2 days, it's likely to remain oscillating slightly bearish. $ETH