
The question dominating the cryptocurrency market is: "How far will this Bear Market go?" Bitcoin, which has accumulated a 17% decline this year, faces a perfect storm of massive institutional outflows from ETFs ($12 billion in three months), global risk aversion, and a lack of clear regulatory support. However, this scenario of intense selling by major players may be paving the way for a future reversal. The focus now shifts to identifying the accumulation zone – the level where selling pressure exhausts itself and from which 'whales' and funds can re-enter with intensity, signaling the end of the downtrend.
MARKET CYCLE SIGNALS
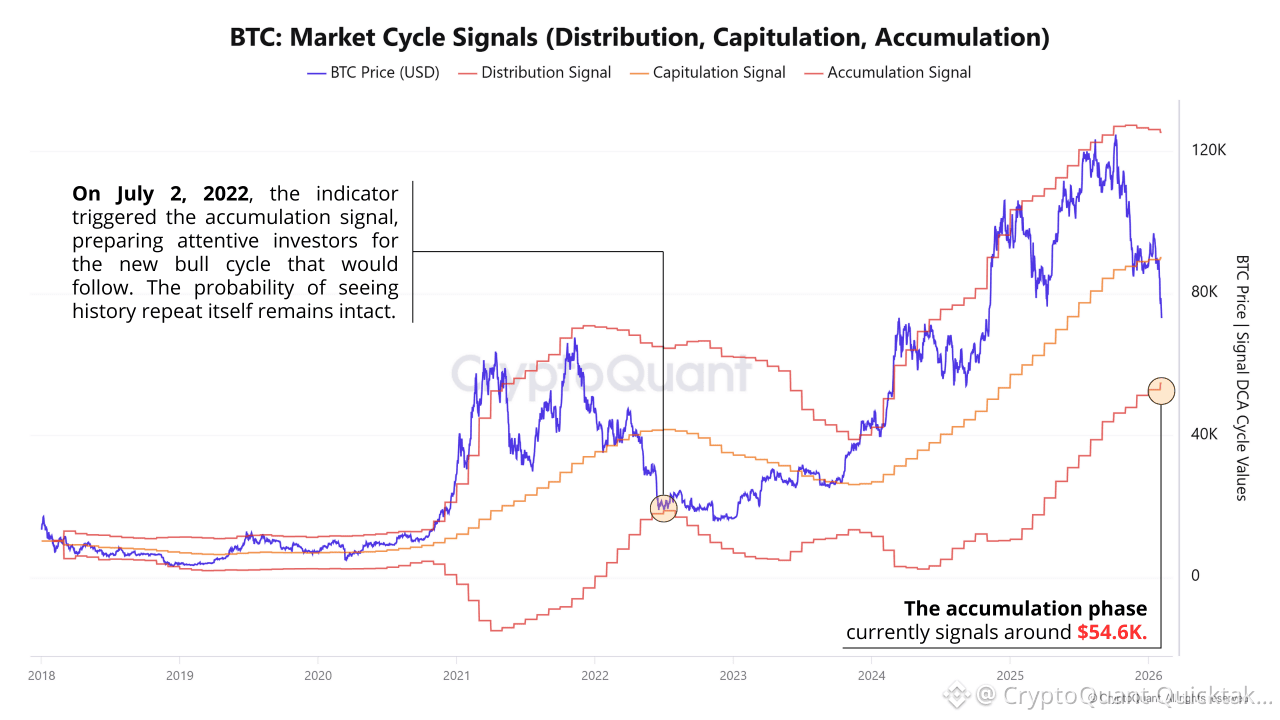
To navigate this turbulence and anticipate the turnaround, a didactic on-chain data-based indicator proves crucial: BTC: Market Cycle Signals (Distribution–Capitulation–Accumulation).
It interprets Bitcoin’s market cycle by segmenting it into three clear phases based on monthly Bollinger Bands:
◾ Distribution → Price touches the upper band (euphoria).
◾ Capitulation → Price crosses the 20‑month moving average in decline and seeks the lower band (panic).
◾ Accumulation → Price finds support at the lower band and consolidates (buying phase).
The current price convergence toward the band signaling the start of the accumulation phase, situated around $54.6K, suggests we are in the critical transition between Capitulation and Accumulation. This level, identified through the historical analysis of BTC: Market Cycle Signals, establishes itself as the prime candidate for the bottom region of this Bear Market.
CONCLUSION
Anticipating market movements is a strategic privilege. Tools like the BTC: Market Cycle Signals convert complex on-chain data into clarity, transforming the investor from a spectator into the architect of their own accumulation. While most wait for the obvious reversal, you will already be positioned in the region where the cycle is reborn.
Written by GugaOnChain