Based on SUI's candlestick chart, the following is an analysis and operational advice based on the current market trend:
Technical Analysis:
Moving Average System (MA):
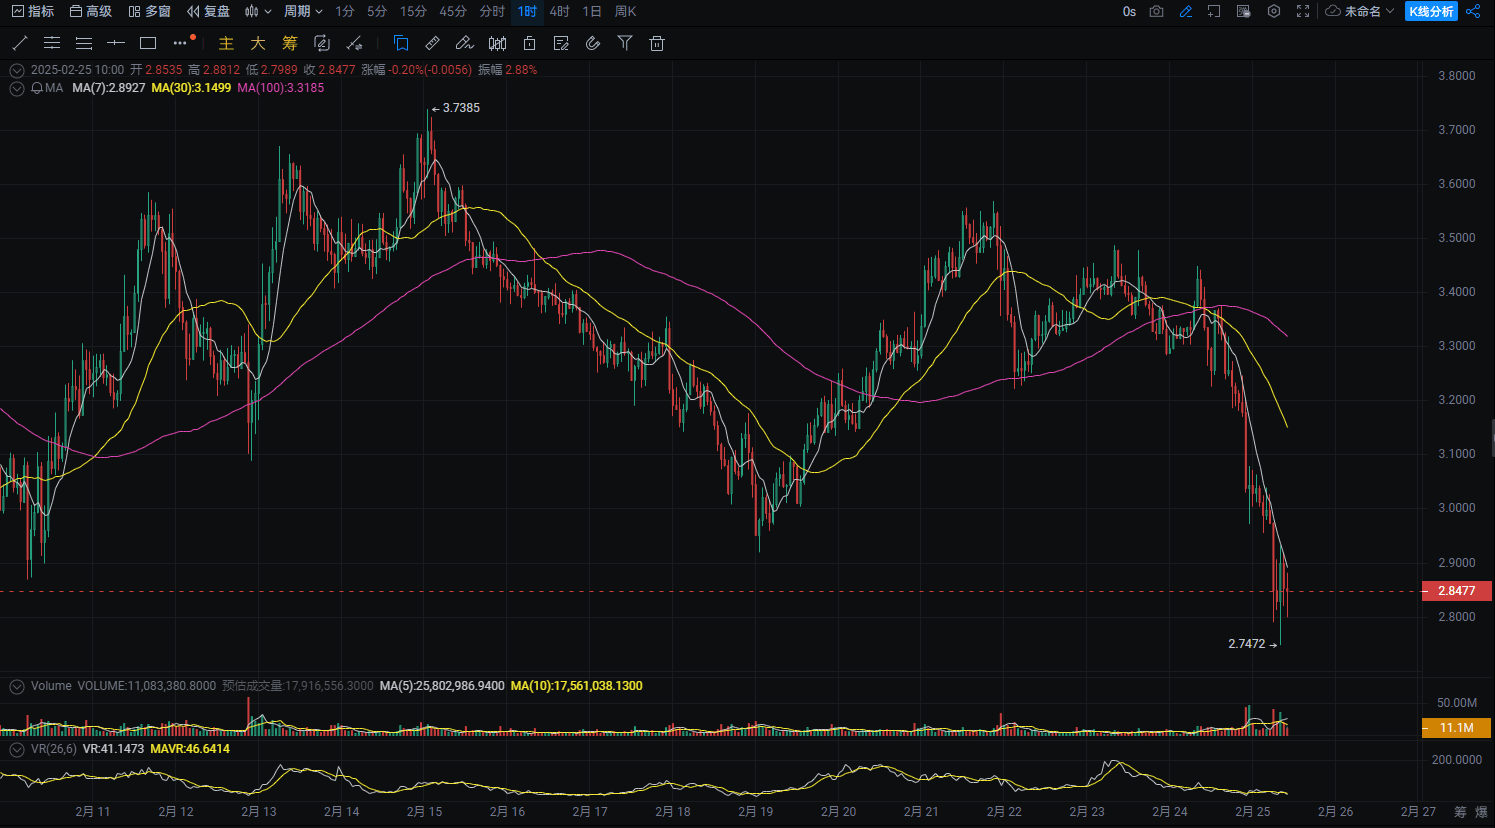
MA7 (2.8927) and MA30 (3.1499) show that the price still has an upward trend in the short term, with a clear short-term recovery momentum.
MA100 (3.3185) shows that the price is still at a relatively low level, but the trend may have the potential to recover.
Trading Volume:
Trading volume has significantly increased in recent days, indicating that market sentiment is gradually recovering. If trading volume continues to expand, it may signal an enhancement in upward momentum.
Relative Strength Index (RSI):
RSI is around 60, indicating a strong range, showing that market sentiment remains healthy and has upward momentum.
Bollinger Bands (BOLL):
The price is currently close to the lower Bollinger Band. If it breaks through the middle band (around 2.85), there may be potential for further rebounds.
MACD Indicator:
The MACD's DIF and DEA are both showing a golden cross formation, and the red bars are gradually lengthening, indicating that upward momentum is continuously strengthening.
Strategy:
Opening Position: Long near 2.8700
First target level: 3.0000 (short-term target)
Second target level: 3.1000 (further target)
Stop loss level: 2.8500 (if the price falls below this level, then stop loss)
#加密市场回调 #Strategy增持比特币 #Infini遭攻击 #以太坊回滚争议 #ETH走势分析 $SUI $BTC $ETH
