
What are Bollinger Bands?
Bollinger Bands, also known as 'Bollinger Bands' and 'Bollinger Lines' (Bollinger Bands, commonly referred to as BBand), is a technical analysis tool.
Bollinger Bands is an indicator that uses the standard deviation and moving averages to analyze price fluctuations and trends. It measures the range of price volatility by creating a price channel between two extreme values and the subsequent trend.
Investors can use Bollinger Bands to determine overbought and oversold conditions in the market. Bollinger Bands constrict price fluctuations within a certain range and provide useful trading signals and information on market momentum.
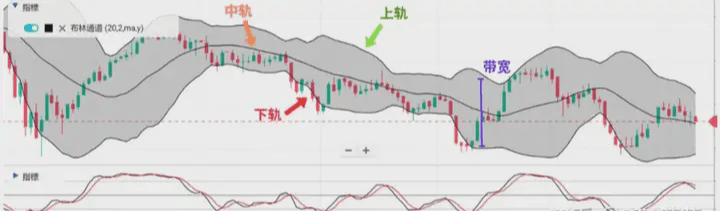
Bollinger Bands consist of three Bollinger bands that construct a Bollinger bandwidth used to observe price volatility and market trends. They are: Upper Band indicating 'overbought' or overvalued levels. Middle Band (SMA), used to measure the average price level. Lower Band indicating 'oversold' or undervalued levels. Bandwidth represents the price safety zone.
To understand the calculations of the Bollinger Bands, one must first grasp the settings and applications, starting with the calculations of the middle band, upper band, lower band, and bandwidth.
The calculation of the middle band: The middle band is the simple moving average over a certain period (n); it represents the price mean over that period and is typically calculated using the simple moving average (SMA).
Calculations of the upper and lower bands.
The upper and lower bands are key components of the Bollinger Bands, used to measure price volatility. Their calculations are based on the middle band and the standard deviation.
Bandwidth calculation: The Bollinger bandwidth is one of the important parameters of the Bollinger Bands. It represents the width of the price channel, which is the distance between the upper and lower bands. The formula for bandwidth is as follows: Bandwidth can help investors identify the amplitude of market price fluctuations and usually provides important market signals when the price channel narrows or expands.
The above are the main calculation steps for the Bollinger Bands. Next, we will understand the settings of the Bollinger Bands.
The parameters of the Bollinger Bands are based on the calculations mentioned above: the core parameters are based on the standard deviation multiple of the simple moving average calculation period. Next, let's explore how these parameter settings of the Bollinger Bands can impact investors' trading strategies.
The simple moving average is used in the calculation of the middle band of the Bollinger Bands. The simple moving average is a method of calculating the average price over a period of time, used to determine the value of the middle band.
Generally, the calculation period for the simple moving average is set to 20. The 20-day SMA is the average of the closing prices over the past 20 trading days.
Of course, this value is not fixed. Depending on different financial products and the investor's own trading strategy, adjustments to the SMA value can be made: shorter periods react more quickly to price changes and are sensitive to short-term trends; longer periods are smoother and more sensitive to long-term trends.
The multiple of standard deviation: another important parameter is the multiple of standard deviation, which is used to determine the upper and lower bands of the Bollinger Bands. The multiple of standard deviation determines the width of the channel.
Typically, the multiple of standard deviation is set to 2, which is the default optimal setting for the Bollinger Bands. Of course, this value is not fixed. Depending on different financial products and the trading strategies of traders, adjustments to the multiple of standard deviation can be made.
Narrow multiples will react more quickly to price changes but may generate more frequent trading signals. Wider multiples will filter out smaller price fluctuations and are suitable for medium- to long-term trading. So why choose 2 standard deviations? This is mainly based on statistics and practical application.
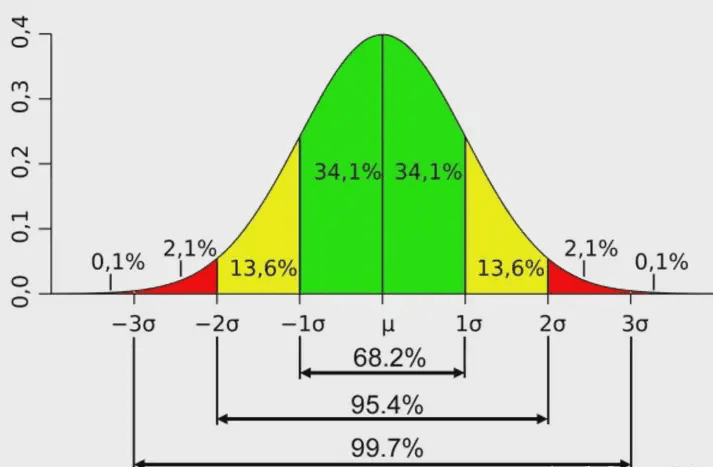
Normal Distribution Chart: In a normal distribution, approximately 68.2% of data points fall within ±1 standard deviation from the mean, about 95.4% fall within ±2 standard deviations, and roughly 99.7% fall within ±3 standard deviations from the mean.
Using 2 standard deviations is because statistics tell us that this distance can cover about 95% of the fluctuation range. In simpler terms, fluctuations within this range are considered 'normal'; if prices exceed this range, they may be abnormal and warrant special attention.
Choosing 2 standard deviations as the upper and lower bands of the Bollinger Bands aims to capture approximately 95.4% of the price fluctuation range, which encompasses most reasonable price data, thereby reducing the likelihood of 'false breakouts.'
Bollinger Bands contraction: When the upper and lower bands of the Bollinger Bands gradually come closer together, the distance significantly decreases. This indicates that market volatility is decreasing and foreshadows potential significant price fluctuations.
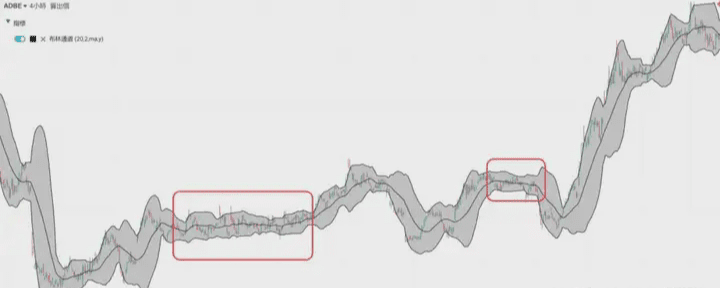
Through the chart above, we can see that the red box indicates that the Bollinger Bands have started to contract, leading to a significant price change.
Bollinger Bands expansion: When the upper and lower bands of the Bollinger Bands rapidly separate and expand, this also indicates increased market volatility, meaning that current price fluctuations are very strong.
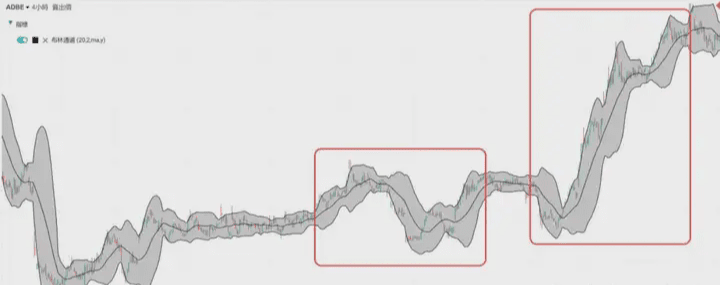
Through the chart above, we can see that the red box indicates that the Bollinger Bands have started to expand, followed by a significant price change.
The upper band touches or breaks the candlestick touching or exceeding the upper band of the Bollinger Bands. This also indicates that the market is overheated, serving as a warning of overbought conditions, but it does not necessarily mean a decline is imminent.
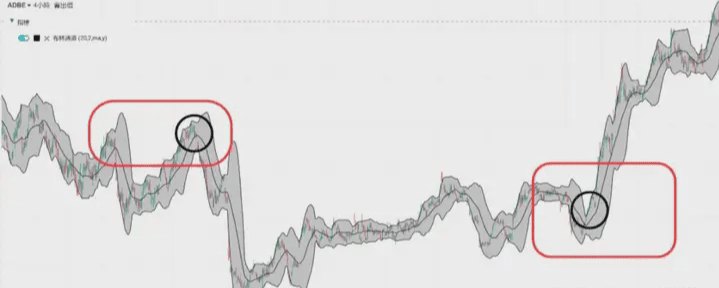
Through the chart above, we can see that the dot in the red box indicates that the candlestick has touched the upper band, which is an overbought phenomenon, but does not necessarily mean a decline is imminent; further observation of the surrounding area is required.
At relatively high price levels, this will serve as a warning bell, alerting traders that this price level is overbought, while at low price levels, it may indicate potential breakthroughs.
The lower band touches or breaks the candlestick touching or falling below the lower band of the Bollinger Bands. This also indicates that the market is oversold, serving as a warning of potential upward movement, but it does not necessarily mean that an increase is imminent.
Through the chart above, we can see that the dot in the red box indicates that the candlestick has touched the lower band, which is an oversold phenomenon, but does not necessarily mean a rebound will occur; further observation of the surrounding area is required. Here, traders need to cautiously observe and combine more indicators to assess the trend.
W-shaped bottom: The W-shaped bottom is a double bottom pattern that forms two distinct low points near the lower Bollinger band, with the second low typically higher than the first. This is a bullish pattern that indicates a potential upward trend.
In this case, investors can choose to buy when the price crosses the middle band, which will reduce trading risks.
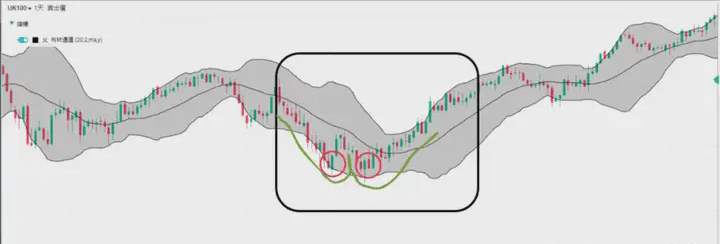
Through the chart above, we can see that the cyan mark in the black box shows a clear W shape, followed by a price rebound and increase.
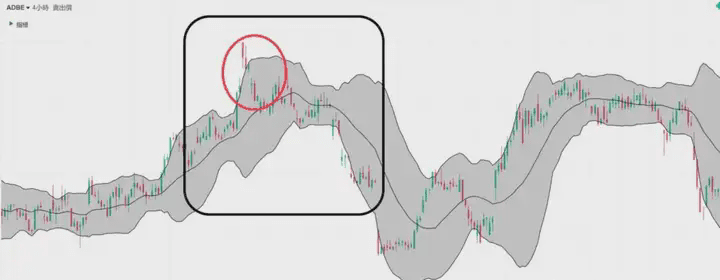
The M-shaped top is a double top pattern that forms two distinct peaks near the upper Bollinger band, with the second peak typically lower than the first. This is a bearish pattern that indicates a possible downward trend.
In this case, investors should be cautious when buying, as this type of pattern has a relatively large downside, and short selling may be considered.
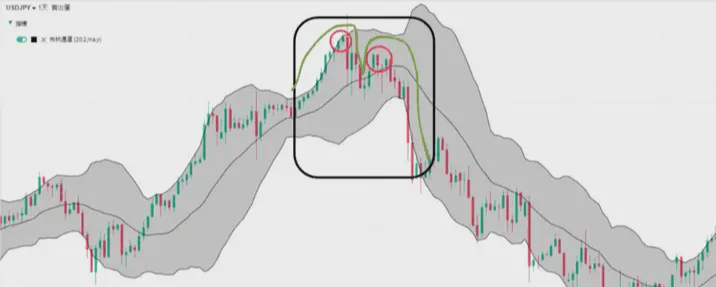
Through the chart above, we can see that the mark in the black box shows a clear M shape, followed by a price decline.
Channel running: When candlesticks consistently run along the upper or lower bands of the Bollinger Bands, it indicates that there is a very strong trend in that direction, and the trend continues. Of course, investors need to be alert to the possibility of price reversals.
Through the chart above, we can see that the mark in the black box indicates that the candlestick has been moving along the upper band, which is also a strong upward trend signal.
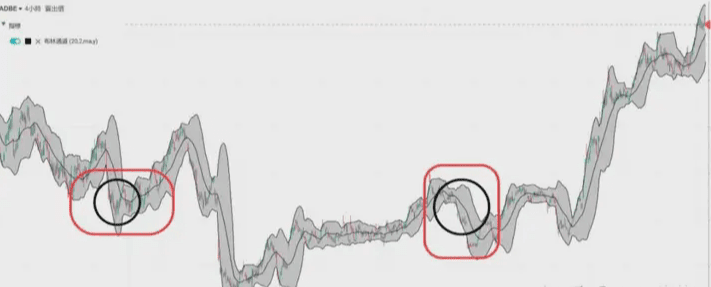
Bollinger reversal: When the candlestick touches the upper or lower band multiple times without a clear trend, moving within the Bollinger Bands, this usually indicates that the market is in a sideways state. Investors can choose to engage in sideways trading during this period, buying low and selling high, until the market shows a clear direction to reassess their trading strategies.
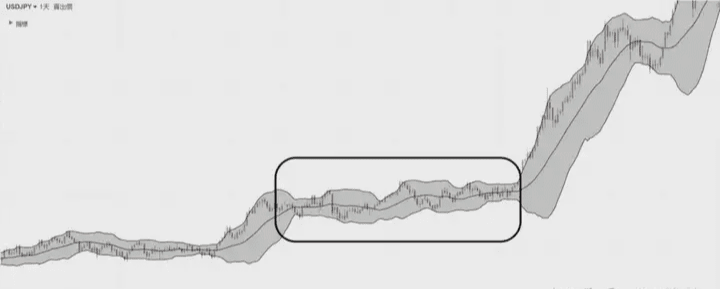
Through the chart above, we can see that a signal of Bollinger reversal has appeared in the black box, and it is noteworthy that a 'Bollinger Bands contraction' follows, ultimately leading to an upward trend.
Bollinger false breakout: The candlestick may suddenly break through the upper band of the Bollinger Bands, but then quickly reverse and drop. This 'false breakout' may be an illusion to attract investors to buy in, rather than a true trend change. Therefore, traders need to be cautious and correlate with other indicators to identify 'traps' or 'opportunities.'
Through the chart above, we can see that a breakout signal above the upper band has appeared in the black box, but the price quickly reversed and dropped significantly, leading the market into a downtrend.
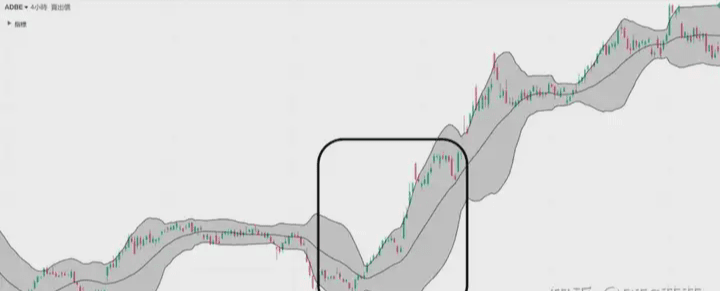
Contraction breakout: When the Bollinger Bands contract (i.e., the distance between the bands decreases), it indicates reduced market volatility. This contraction usually signifies market consolidation, serving as a prelude to a significant price move.
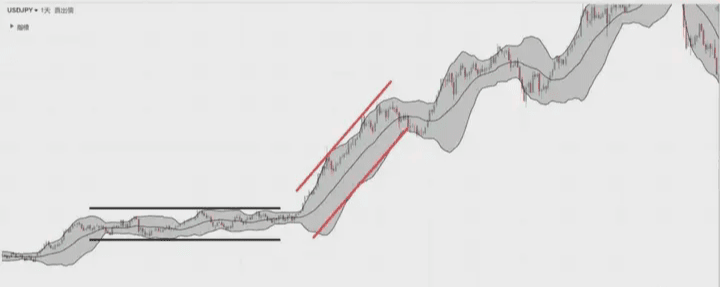
Through the chart above, we can see that the black box indicates that the Bollinger Bands have transitioned from a Bollinger reversal to a gradual contraction, which is during a consolidation period.
After a certain extent, as shown in the red box, the market begins to leave the consolidation phase, breaking through as the Bollinger Bands begin to expand and continue to rise.
Through the explanations above, I believe you will gain a deeper understanding of these 10 patterns of Bollinger Bands and can further apply this theoretical knowledge to actual trading strategies, thus making more effective decisions.
However, like any other technical analysis tool, Bollinger Bands also have their advantages and disadvantages.
Using Bollinger Bands in conjunction with other indicators can help traders identify potential buying and selling points, as Bollinger Bands not only recognize market volatility but also assist in strategizing. Below, we will explore how to combine Bollinger Bands to develop practical trading strategies.
Bollinger Bands paired with MACD indicator: The MACD indicator, Moving Average Convergence & Divergence, is a trend-following indicator used to analyze the momentum of price movements, consisting of a fast line (DIF), a slow line (DEA), and a histogram.
The MACD crossover can also serve as a buy and sell signal; of course, it should be appropriately combined with Bollinger Bands to confirm market trends.
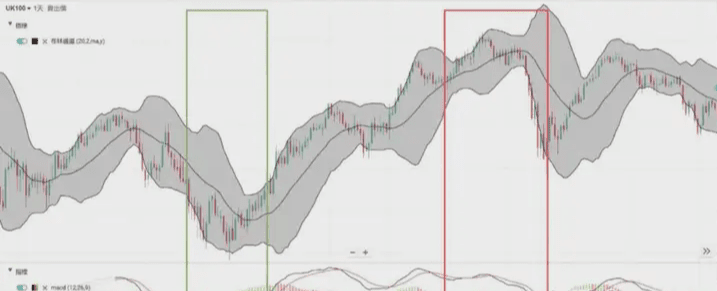
Through this case: In the example marked in red, it can be observed that when the stock price reaches a relatively high level, the candlestick is above the middle band of the Bollinger Bands and touches the upper band, followed by the MACD line showing a death cross at a high position, and then the trend begins to turn downward. In the cyan-marked example, the opposite case is observed; when the stock price falls back, it is below the middle band of the Bollinger Bands and touches the lower band, and then the MACD shows a golden cross afterward, gradually turning the trend upward. By combining these two indicators, investors can apply this composite indicator as a key investment strategy for both short-term and long-term investments.
Using Bollinger Bands with the MACD indicator can help investors gain a deeper and more comprehensive understanding of the price trends of financial products.
Next, the combination of Bollinger Bands and the RSI indicator also has unique value. Therefore, we will explore how to effectively utilize Bollinger Bands and the RSI indicator to provide traders with alternative investment strategies and perspectives.
Bollinger Bands paired with the RSI indicator: The RSI indicator (Relative Strength Index) is a momentum oscillator used to analyze recent market price fluctuations to evaluate the relative strength balance and counteraction between buying and selling over a specific period.
The RSI indicator is typically used to determine whether an asset is overbought or oversold. Of course, when combined with Bollinger Bands, it can confirm market trends.
The value of RSI ranges from 0 to 100; when it exceeds 70, it indicates overbought conditions, while below 30 indicates oversold conditions.
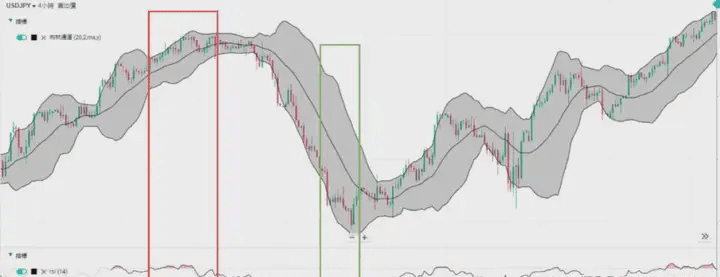
Through this case: In the example marked in red, it can be observed that when the stock price reaches a relatively high level, the candlestick is above the middle band of the Bollinger Bands and touches the upper band, followed by the RSI exceeding 70, and then the trend begins to turn downward. In the cyan-marked case, the opposite is observed; when the stock price falls back, it is below the middle band of the Bollinger Bands and touches the lower band, and then the RSI falls below 30, gradually turning upward. By combining these two indicators, investors can apply this composite indicator as a core investment strategy for both short-term and long-term investments.
Bollinger Bands can help identify the range of price fluctuations and potential overbought or oversold states, while RSI provides information about price momentum.
When both are used together, multiple corroborating signals will make investors more confident in predicting future market trends.
Bollinger limit indicator: The Bollinger limit indicator, also known as '%B' (Percent B), is a derived indicator of the Bollinger Bands. It quantifies the Bollinger Bands and helps traders determine the relative position of the price within the Bollinger Bands.
In trading, please remember: volume and price synchronization often reflect the health of the trend, while volume and price divergence may indicate a trend reversal.
Learn to recognize these volume-price relationships and flexibly apply them in actual trading, significantly enhancing your trading win rate.
Cryptocurrency Trading Advice:
1. Do not easily discard bullish coins; prioritize bullish coins, take the middle path, engage in both hot and strong coins, suitable for both investment and speculation.
2. The key for traders is the ability to adapt in real-time.
3. Qualitative assessment is essential. Qualitative analysis on a large scale, selecting currencies on a weekly basis, validating on a monthly basis, and tracking on a daily basis.
4. Follow the rules strictly; use Bollinger Bands or any moving average you find feasible to gauge the market.
5. Ability is taught without calculation; it relies entirely on technical skills. Repeat successful experiences until making money becomes a habit; making consistent profits is more important than making large profits.
Hello everyone, I am Lao Wang. I joined the cryptocurrency circle eight years ago, went through bull and bear markets, and am now financially free. One cannot succeed alone; a lone sail cannot sail far! In this circle, if you don't have a good community or first-hand news from the cryptocurrency world, I recommend following Lao Wang to help you get on board. Welcome to join the team!!!$BTC $ETH

