2025.12.13
Market Review
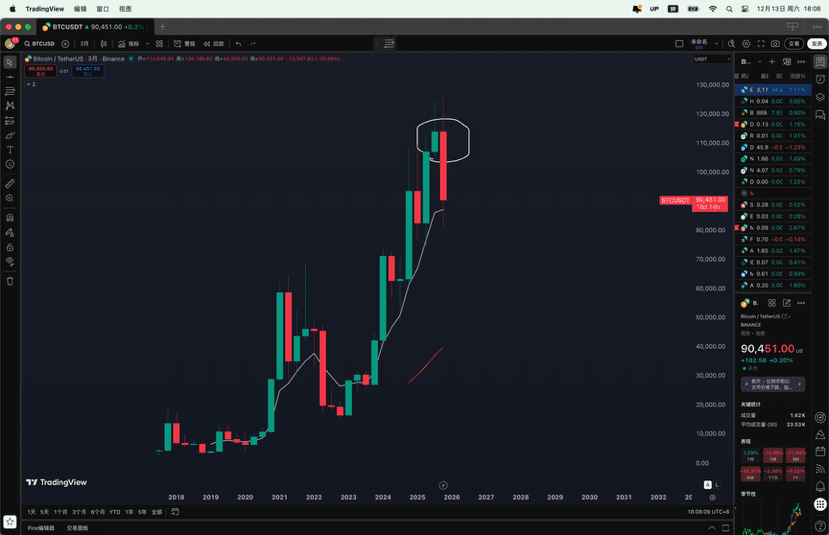
Quarter
In July, the quarterly K-line showed a decrease in volume with a long upper shadow, indicating signs of a top formation. Currently, the October quarterly K-line has expanded and engulfed, changing the upward trend. We are in a somewhat bearish state now, but the specifics will depend on the closing line. Regardless of how this quarter closes, the next quarter's K-line will still have a lower shadow to test below. Even if there is an upward movement, there will be a pullback to create a lower shadow before rising again. Therefore, the strategy is that if the next quarter opens upward, look for shorting opportunities at high positions; if it opens downward, look for long opportunities at low positions. If the closing line for 2026.1.1 is not good, then the larger direction for operations may be to short at highs. If the closing line is decent, then there will be opportunities for going long.
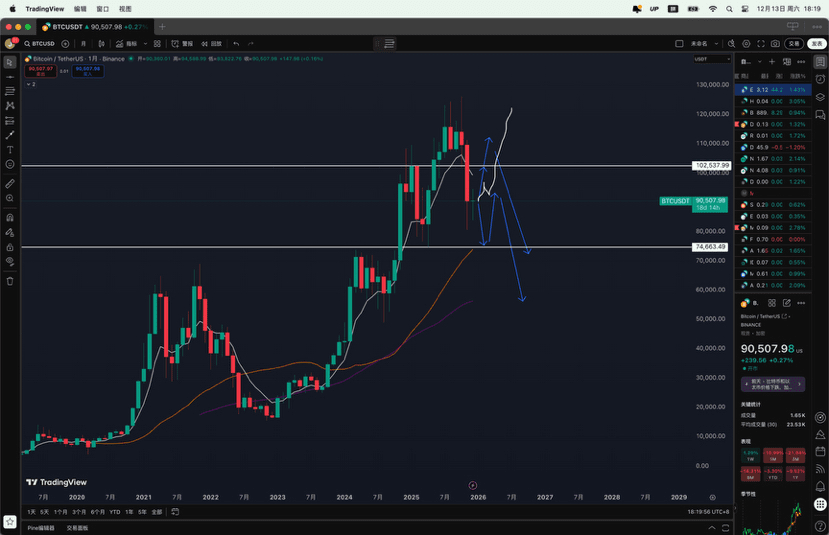
Monthly:
Currently in a bearish continuation position, it needs to wait for confirmation from smaller time frames whether to rebound from the bottom here or continue to decline. The support below is at 73-74; if it chooses to go down, a decline to this position can be an opportunity for a rebound trade. Just a rough sketch, take a look.
Weekly:
Still in a position of a bearish continuation rebound, the first support below is around 86-87000, waiting for tomorrow's closing confirmation. There may still be consolidation here. The longer the horizontal movement, the higher the vertical movement; the longer the consolidation time, the higher the rebound can be, and the same goes for declines.
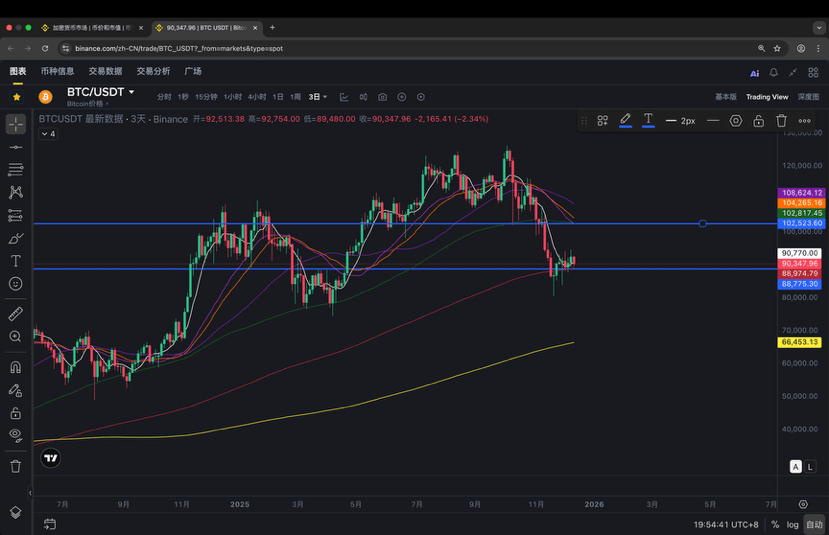
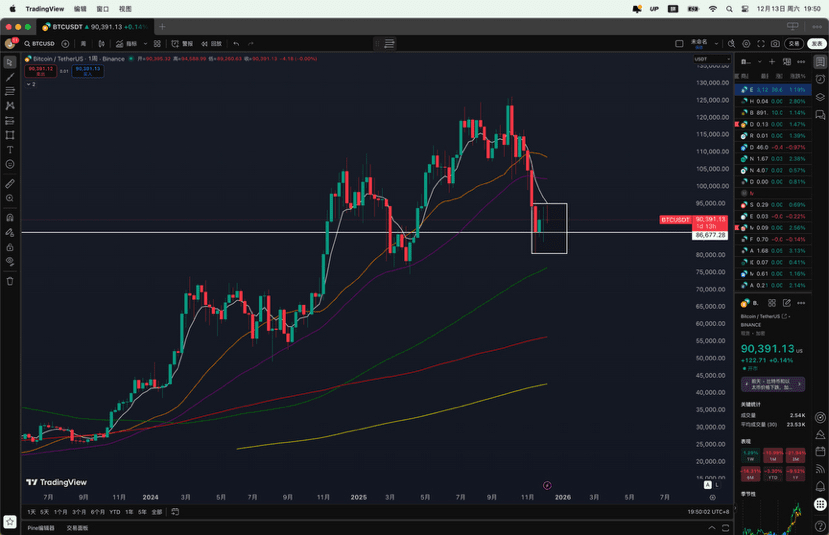
3-day line:
The current 3-day line is performing well, still above the 200ma support, and the short-term trend remains bullish above the support. The strong resistance is around 102500. If it breaks upward in the future, consider shorting here. If it breaks below the 200ma support, the upward trend will be broken, and it will be necessary to consider shorting or adding to the short position.
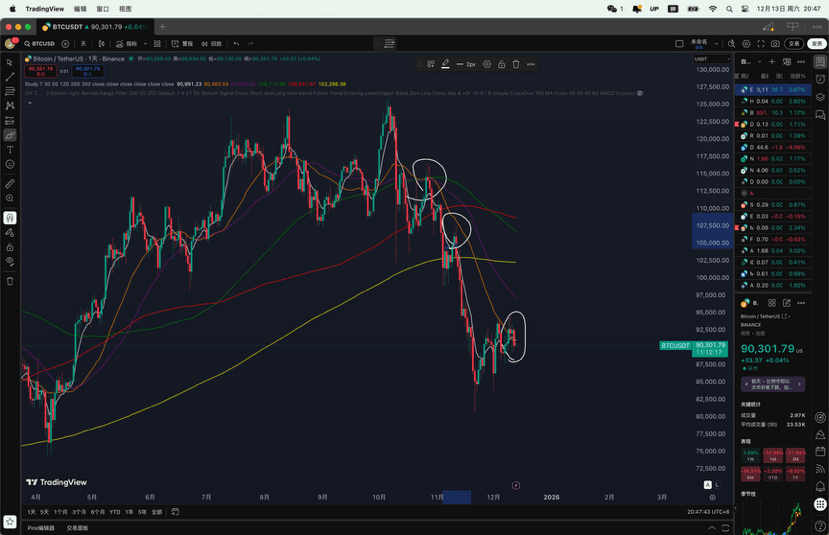
Daily:
Since the decline in October, it attempted to break above ma30 for the first time but was knocked down again. The candlestick on 12.12 engulfed the previous gains, indicating a weakening market. The first resistance for the rebound is around 91000. If a rebound is desired, the candlestick needs to move for repair.
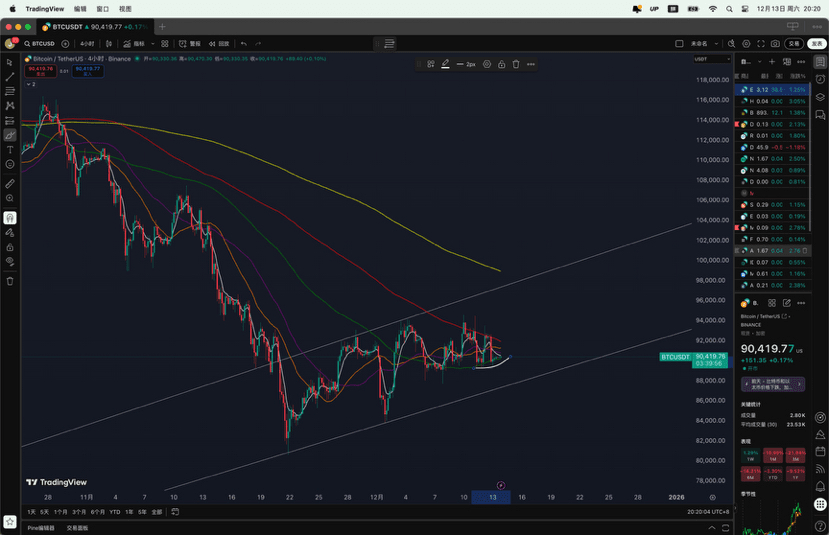
4-hour:
Forming a volatile wide channel, currently supported above the 120 moving average, waiting for direction. Apart from last night hitting the support at 89400, there is an opportunity for a rebound, but currently, there are no good trading opportunities. If it breaks below around 89400, consider shorting.
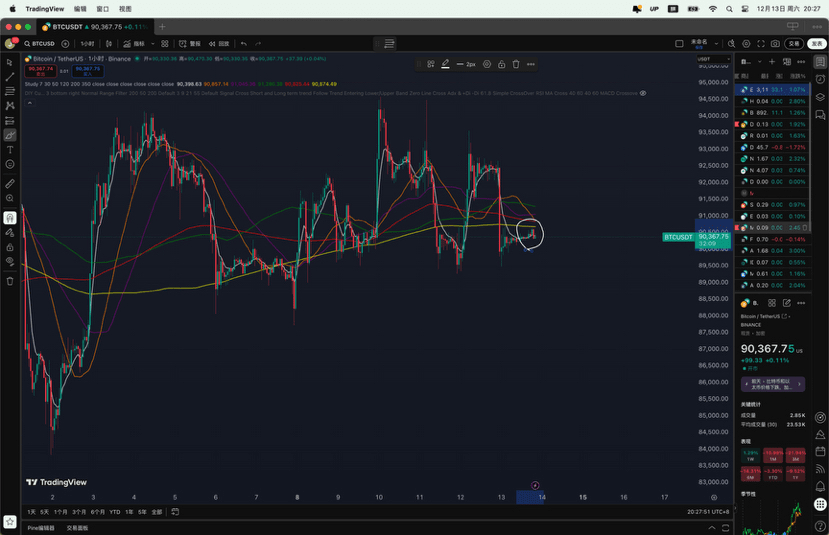
1-hour:
Met resistance and is currently bearish in the short term; it needs to rise above the yellow moving average to indicate strength.
