According to the latest market dynamics on December 15, 2025, Bitcoin (BTC) experienced significant drops and rebounds today. Below is an analysis of its core performance on the one-hour K-line chart on Binance.
📊 Today's Core Market Overview
Today's BTC market shows a 'V-shaped trend' of 'rapid rebound after breaking down', with market sentiment experiencing a shift from panic to easing.
Intraday Trend: Morning saw a significant drop, at one point falling below $88,000, reaching a low of around $87,500, then a strong rebound, returning above $89,000.
Latest Price: As of this morning, the price is reported in the range of $89,245 - $89,903.
Market impact: Severe volatility has led to a total liquidation amount of $270 million across the network within 24 hours, with more than 115,700 people liquidated, among which long positions suffered heavy losses.
Causes of the decline: Mainly influenced by the sudden cooling of macro sentiment regarding the Federal Reserve's interest rate cut expectations, and bearish statements from institutions have exacerbated sell pressure.
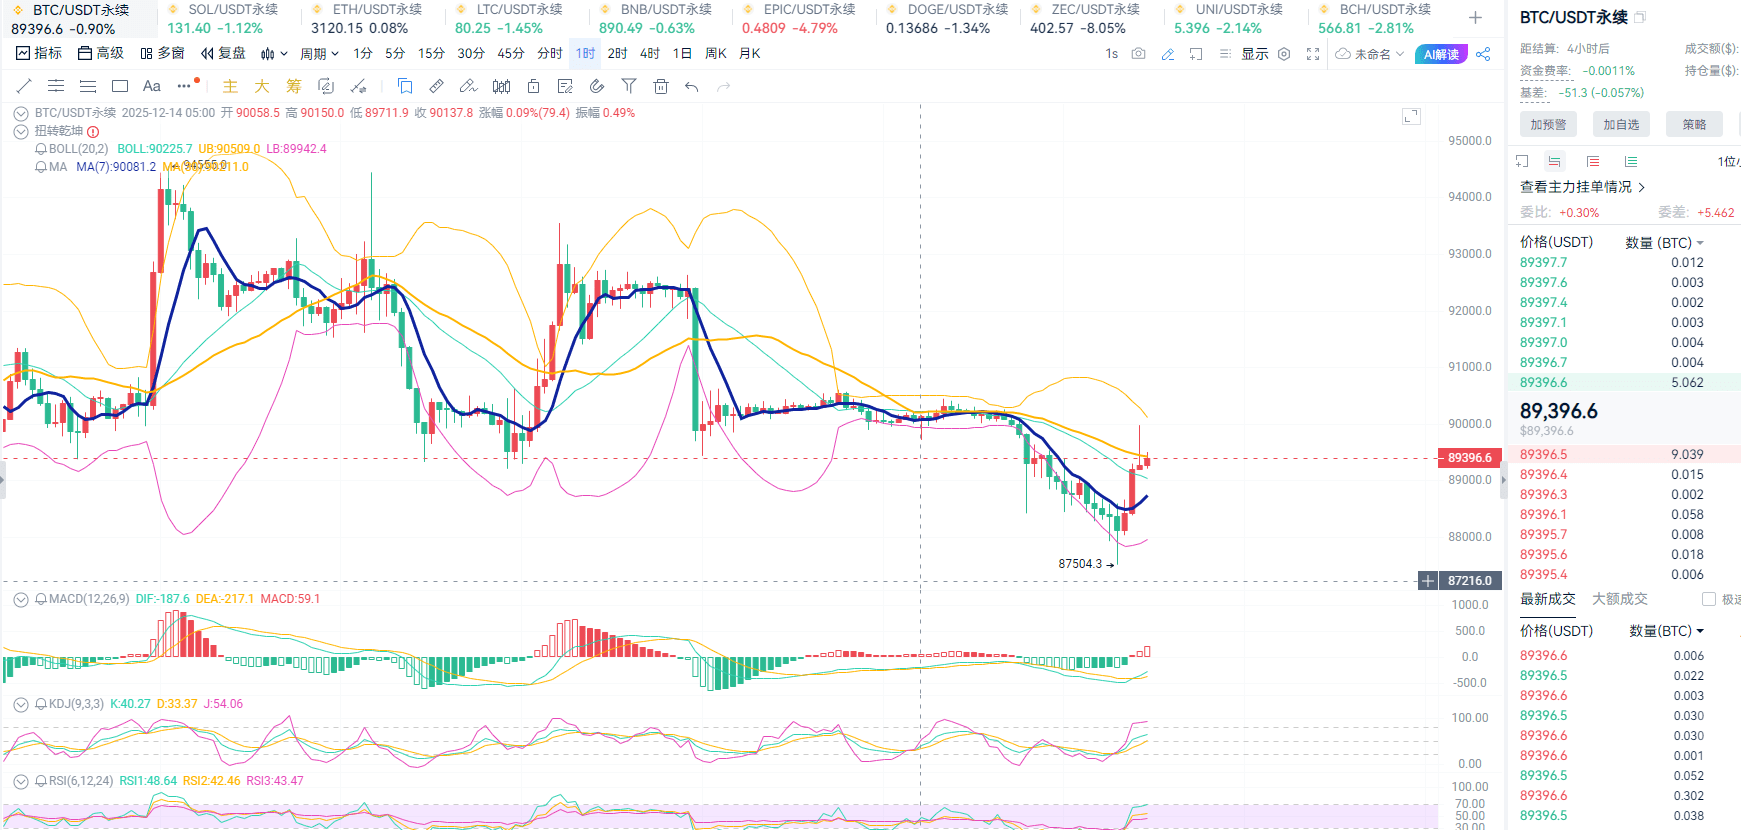
📈 Key technical structure analysis on the hourly chart
Based on professional analysis, the technical structure of the current hourly chart has turned bearish, with specific characteristics as follows:
Overall pattern: Bears dominate.
The price has broken below the previous days' low support.
The Bollinger Band (BOLL) channel is forming an opening pattern, indicating that significant volatility may be imminent, with prices extending towards the lower band (approximately $88,000).
Key indicator signals
MACD: Below the zero axis, with a growing green momentum bar, and DIF and DEA showing a second divergence opening phenomenon, indicating that the downward momentum is still being released.
KDJ and RSI: KDJ three-line crossing downward to low levels (close to 15); RSI failed to turn upward and is heading downward again, indicating that the short-term downward space may not yet be finished.
Key price level competition between bulls and bears
Resistance above: Core resistance at $90,500 (4-hour Bollinger Band midline, and continuing to press down), this can serve as a key resistance level for intraday rebounds.
Support below:
First support: $87,100 (Bollinger Band lower band on the daily chart).
Deep support: If $87,100 is breached, the market this week may drop to $86,500 or even deeper regions.
💡 Market sentiment and operational reference
Although current market sentiment has somewhat recovered from early extreme panic, it remains cautious overall. Analyst 'Crypto Circle Red Sister' has a reference viewpoint, and her suggested operational strategy is: focus on shorting after a rebound, cautiously seize rebounds.
Short position strategy: Consider light shorting if a rebound occurs near $89,600, with a stop loss set above $90,500, targeting $88,700-$87,100.
Long position strategy: Only consider light long positions if the price drops below $87,100, and strict stop losses must be set (e.g., below $86,500), take profits quickly rather than being greedy.
Note: All the above analysis and levels are based on publicly available information and are for reference only. Cryptocurrency is highly volatile, please make decisions based on real-time charts from Binance and ensure proper risk management.
I hope this analysis of today's market can be helpful to you. If you want to further understand the trend analysis of other major cryptocurrencies such as Ethereum (ETH) or Solana (SOL) today, I can continue to provide you with information.
