
After the Dogecoin to USD exchange rate broke below the $0.1320 area, a new round of decline began. Currently, Dogecoin is consolidating its losses and may face resistance around $0.1350.
DOGE price fell below $0.1320, beginning a new round of decline.
The current price is below the $0.1300 level and the 100-hour simple moving average.
On the DOGE/USD hourly chart, a key descending trendline is forming, with resistance at $0.1340 (Source: Kraken).
If the price remains below $0.1340 and $0.1350, the downtrend may expand.
The price of Dogecoin has fallen again
After Dogecoin closed below $0.1380, it began a new round of decline, similar to Bitcoin and Ethereum. Dogecoin broke below the support levels of $0.1350 and $0.1340.
The price even briefly fell below $0.130. The low is close to $0.1266, and the current price shows bearish signs. It is consolidating below the 23.6% Fibonacci retracement level of the decline from the $0.1530 high to the $0.1266 low.
The price of Dogecoin is currently below the $0.1300 mark and the 100-hour simple moving average. If there is a rebound, the immediate resistance level above is around $0.1325. The first major resistance level faced by bulls may be around $0.1340. Additionally, a key descending trendline is forming on the DOGE/USD hourly chart, with resistance at $0.1340.
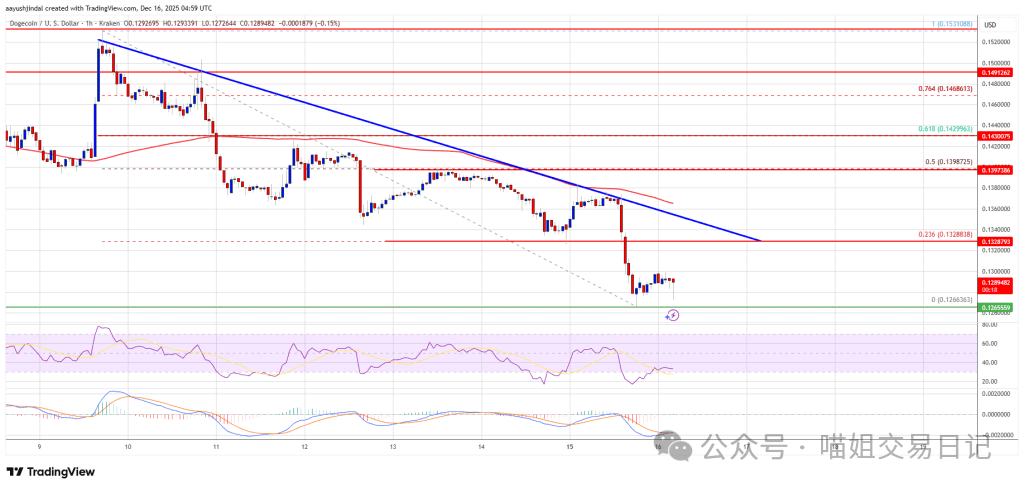
The next major resistance level is around $0.1400, which is also the 50% Fibonacci retracement level from the $0.1530 high to the $0.1266 low. If the closing price is above the $0.1400 resistance level, the price may further rise to the $0.1450 resistance level. If the price continues to rise, it may further test $0.1500. The next major stop-loss level for bulls could be $0.1550.
Will the decline of Dogecoin continue?
If the price of Dogecoin (DOGE) fails to break above $0.1350, it may continue to decline. The initial support level is around $0.1280. The next major support level is around $0.1250.
The main support level is at $0.120. If the price breaks below the $0.120 support level, it may decline further. In this case, the price could short-term drop to $0.1050 or even fall to $0.10.
Technical indicators
Hourly MACD indicator – The MACD for DOGE/USD is currently accelerating lower in the bearish zone.
Hourly Relative Strength Index (RSI) – The RSI for DOGE/USD is currently above the 50 level.
Major support levels – $0.1280 and $0.1250.
Major resistance levels – $0.1340 and $0.1350.


